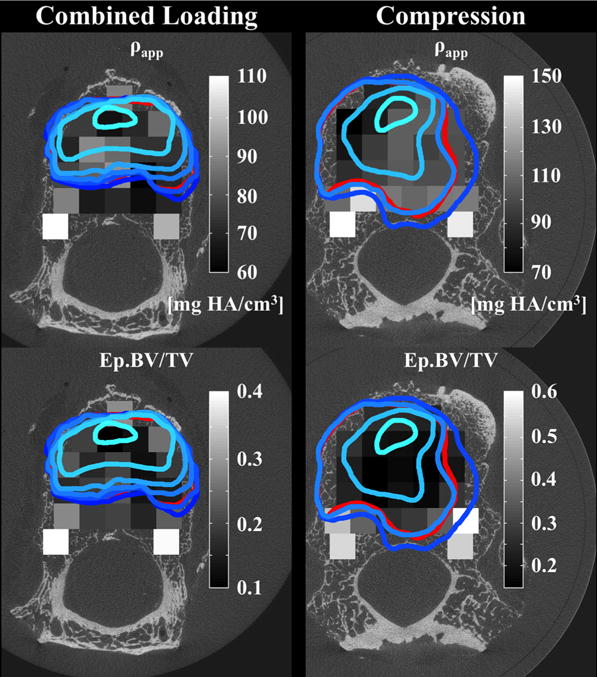
Fig. 7.

Regions of large endplate deflection (outlined in blue and red), defined as axial deflection exceeding 0.5 mm, superimposed on the distribution of apparent density (ρapp, grayscale) of the underlying trabecular bone and on the distribution of endplate volume fraction (Ep.BV/TV, grayscale): The lightest blue outline corresponds to the loading increment just prior to or at the peak of loading. The boundaries at subsequent increments are represented with progressively darker shades of blue. The red outline corresponds to the endplate deflection remaining after the test was complete and all applied loads were removed.
