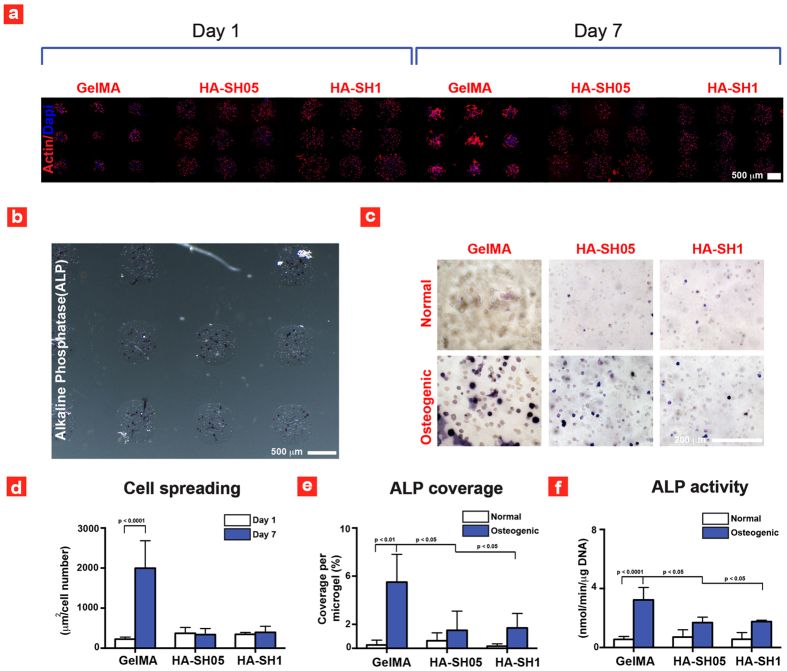
Figure 3. Cell spreading and differentiation within the deposited microgels.
(a) Fluorescence images of hMSCs within the printed microgels. (b) Optical image of ALP stained gel microgel array and (c) optical images showing the ALP expression inside different microgels. (d) Quantified cell spreading data after 1 and 7 days of culture. (e) ALP coverage of the different constructs at day 7 and (f) Analyzed ALP activity after 7 days of culture. GelMA ALP data in (f) is taken with permission from ref. 25.

