
Figure 7. Schematic Diagram Representing the Roles of FhGL3L to Control the Anthocyanin Biosythesis and Trichome Formation in Arabidopsis.
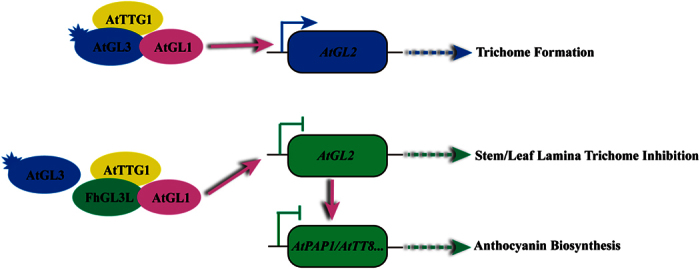
The regulatory proteins were represented by ellipse with different colors. Proteins with transactivation capacity are marked by sparks. Solid arrows represent direct transcriptional regulation,  for activation and
  for repression, respectively, whereas the dotted arrow shows a series of increased concentration of genes leading to the biosynthesis of corresponding products.