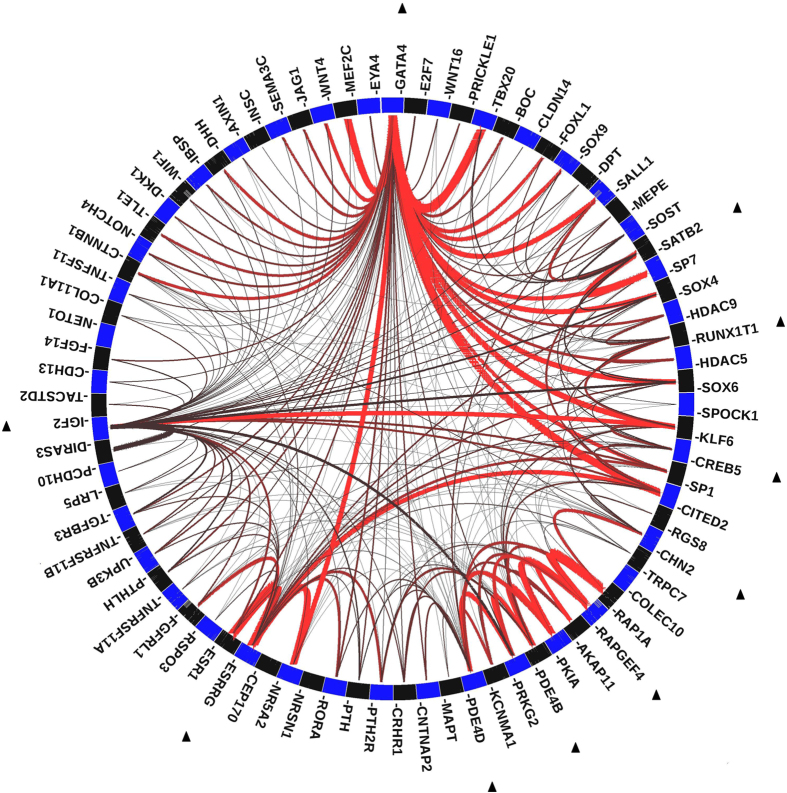
Figure 2. Connections between the top ranking predicted genes and the known osteoporosis-associated genes.
Ten out of the 20 predicted genes, which are marked by black triangle, are connected with 69 known osteoporosis-associated genes. The lines between genes represent individually significant connections that contribute to the positive signal, with the thickness of the lines being inversely proportional to the probability that a literature-based connection would be seen by chance.

