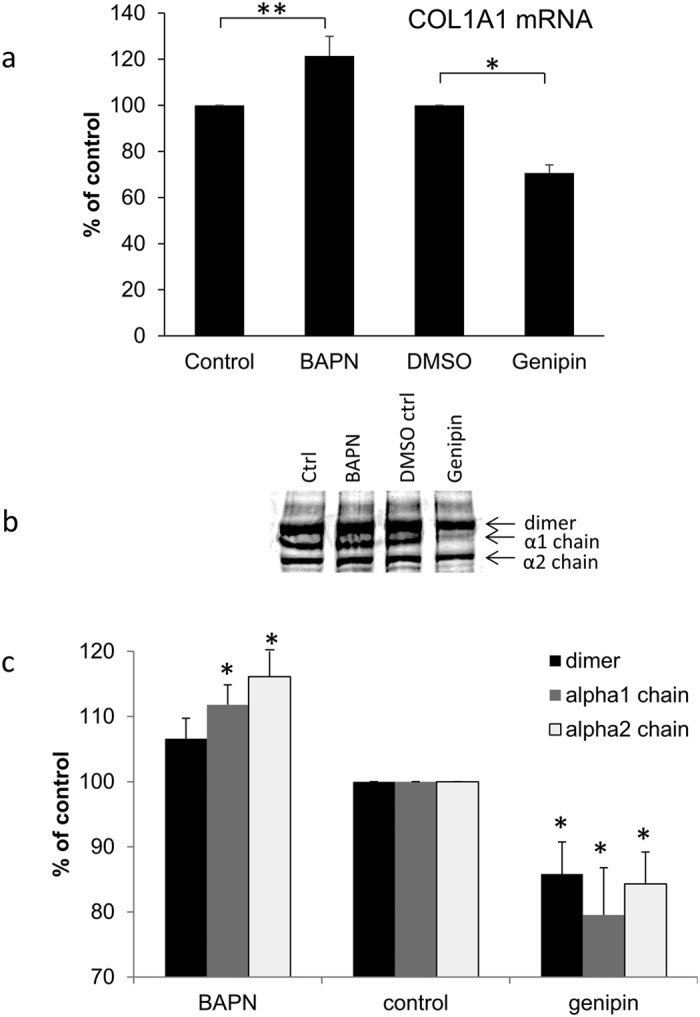
Figure 4. Effects of BAPN and genipin on collagen type I.

(a) Quantitative RT-PCR of COL1A1 mRNA in TM cells treated for 24 hours with BAPN or genipin. Results are shown as a percentage of their respective controls. Data are average ± standard error of the mean. N = 4; *p = 0.001; **p = 0.021. (b) Representative Western immunoblots of collagen type I synthesized by TM cells treated for 48 hours with BAPN or genipin. The positions of the α1 and α2 collagen chains and their dimer are shown. Molecular weights are shown in kDa. (c) Densitometry of each of the three bands relative to its control. Data are average ± standard error of the mean. N = 3; *p < 0.05.
