Figure 7.

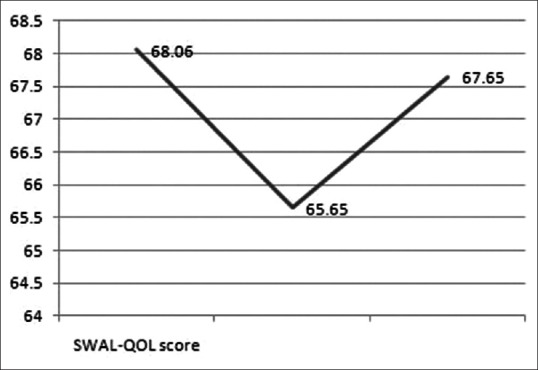
Diagram of curves showing the changes of swallowing quality of life score from preoperative to immediately postoperative until to the final followup

Diagram of curves showing the changes of swallowing quality of life score from preoperative to immediately postoperative until to the final followup