Figure 4.

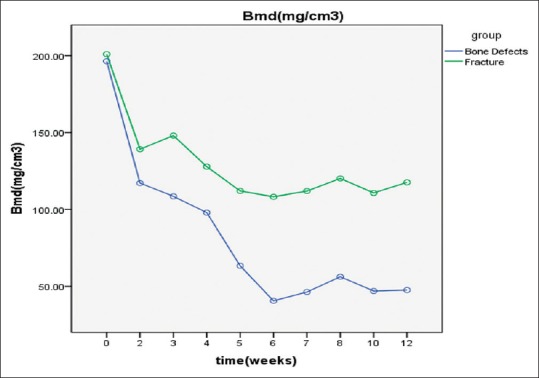
Postoperative time course for bone mineral density shown by quantitative computed tomography at 12 weeks after surgery. The data are shown as absolute values. Each data point is a mean

Postoperative time course for bone mineral density shown by quantitative computed tomography at 12 weeks after surgery. The data are shown as absolute values. Each data point is a mean