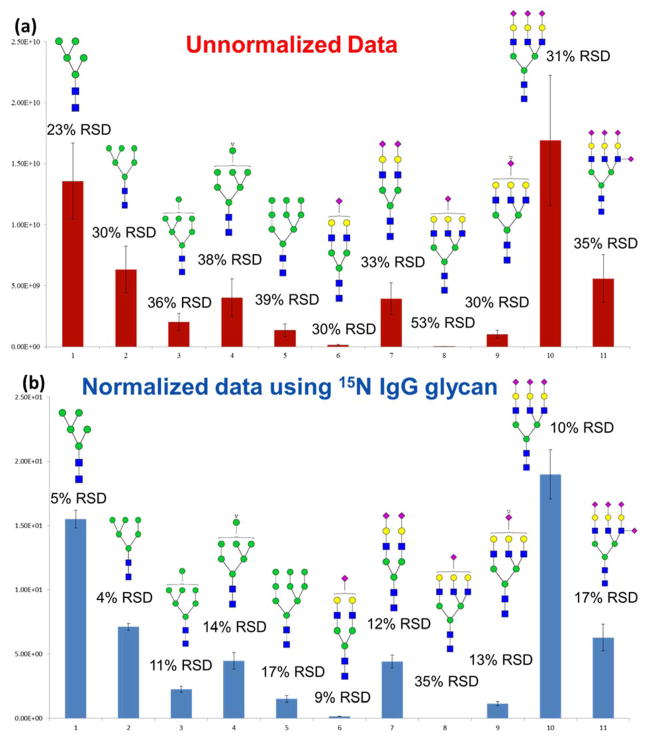
Figure 3.
Bar graphs representing intensity variation of biological (n = 3) analyses of N-glycans released from model glycoprotein mixtures a) without normalization and b) with normalization using 15N-glycans derived from iGlycoMab. Symbols: as in Figure 1.

