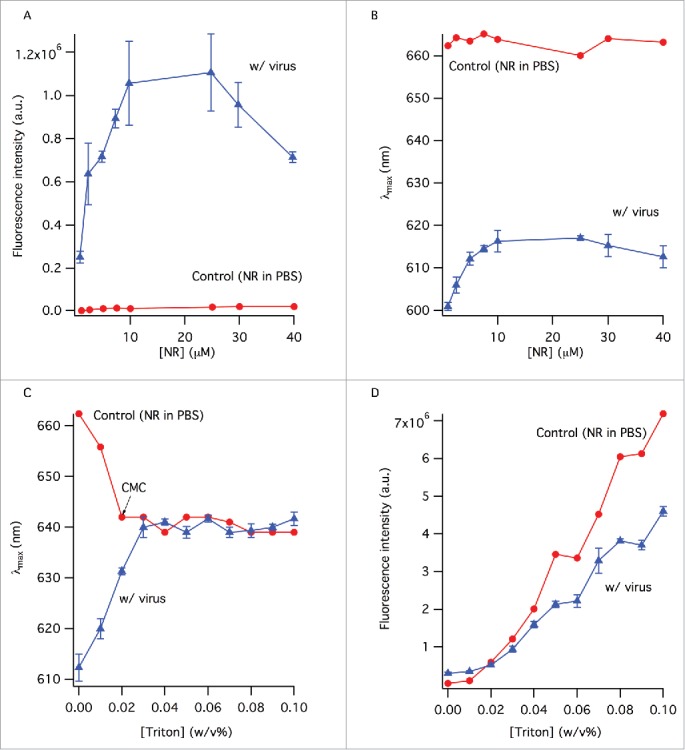
Figure 1.

The change of the fluorescence intensity (A) and peak wavelength (B) as a function of NR concentration. Control sample contained NR in PBS. Samples with virus contained the same amount of NR as the control samples. (C) The change of peak wavelength in the absence and presence of virus with TX-100 concentration. (D) Error bars represent standard deviation (n = 3).
