
Figure 2.
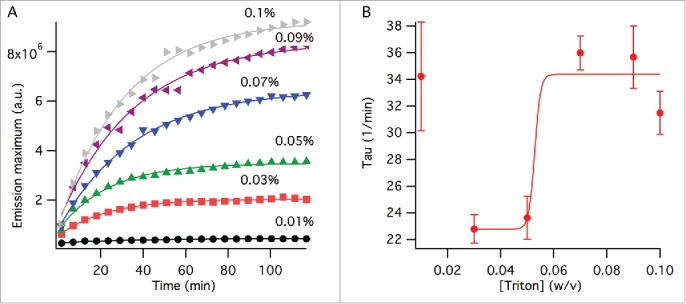
Viral splitting kinetics probed by NR fluorescence. (A) Change of the emission peak intensity with time at varying TX-100 concentrations (w/v). The lines show fits to single exponential function as outlined in the method section. (B) Time component, , obtained from the curve fits in (A). The line is a curve fit by a sigmoidal function excluding the data point at 0% TX-100 as outlined in the method section. The error bars represent standard deviation generated by the curve fits from (A).