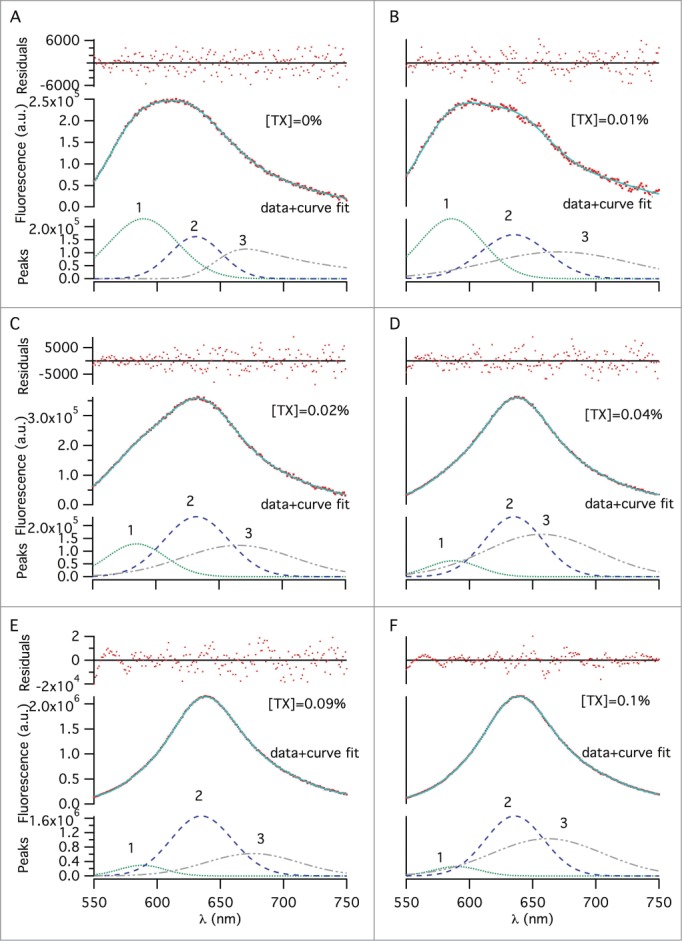
Figure 3.

Multi–peak fitting using the exponentially–modified–Gaussian fitting function, showing dye molecules populated in 3 distinct environments, across different TX-100 concentrations (w/v): (A) 0%, (B) 0.01%, (C) 0.02%, (D) 0.04%, (E) 0.09%, and (F) 0.1%. An emission wavelength range of 550–750 nm was selected for peak fitting to exclude noise from the 2 tails. The 3 fitted peaks, representing 3 distinct dye environments, make up each spectrum. The solid lines represent the sum of the peaks 1–3. Change of the area under, and, the maximum emission wavelength of each fitted peak was determined for the different surfactant concentrations to quantify splitting extent.
