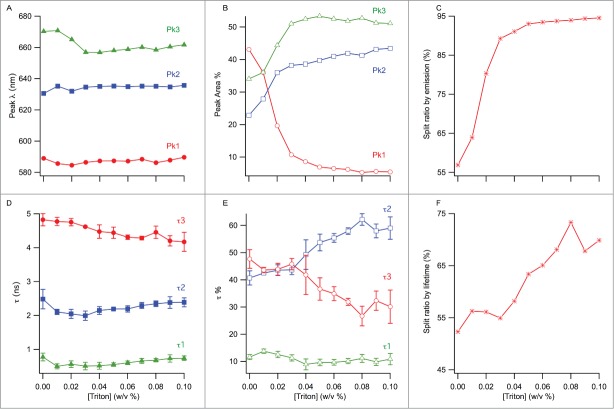
Figure 4.
(A) Change of the peak wavelengths from multi-peak fitting with TX-100 concentration. (B) Change of the % areas of the peaks from (A) with TX-100 concentration. (C) Split ratio by emission, calculated as a sum of peak 2 and 3's % areas. (D) Change of the 3 fluorescence lifetimes as a function of TX-100 concentration. (E) Change of the weighted % contributions of the lifetimes from (D) to the total lifetime decay, as a function of TX-100 concentration. (F) Split ratio by lifetime, calculated as a sum of tau 1 and tau 2's % contributions. The error bars represent standard deviation (n = 3).

