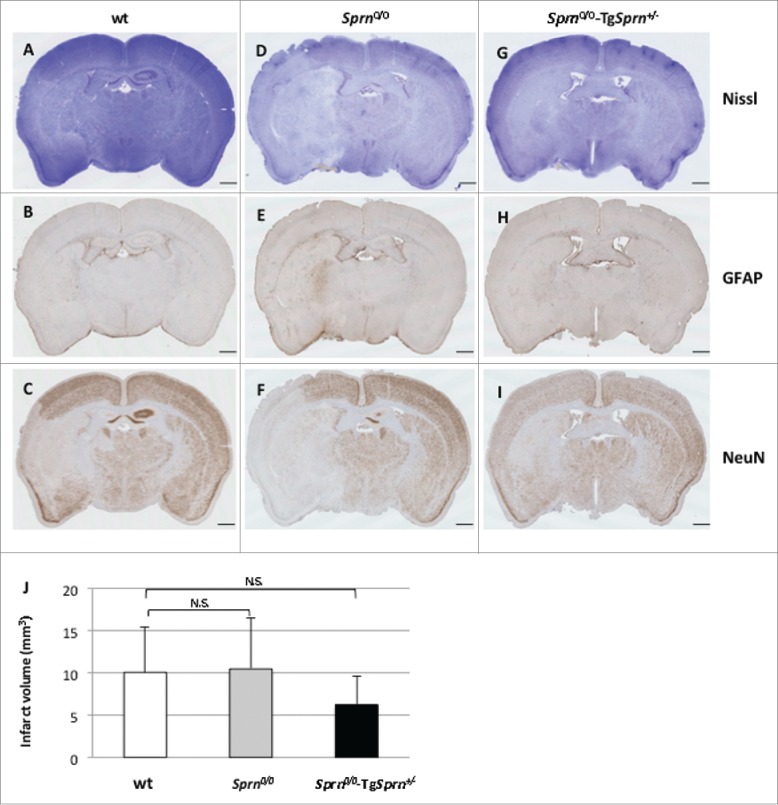
FIGURE 3.

Immunohistochemical staining of 3 mouse genotypes 24hrs post treatment. Nissl staining of cerebral infarction. Representative sections of wt (A, B, C), Sprn0/0 (D, E, F), and Sprn0/0-TgSprn+/− (G, H, I) mice are shown. Normal tissue is stained deep blue while infarcted tissue with loss of neurons appears clearer (A, D, G). Immunohistochemistry is shown representing the effect of brain ischemia on the expression of protein GFAP (B, E, H) and NeuN (C, F, I). J represents a quantification of the size of the infarct volume in the 3 different genotypes (n = 8, 7, 8, respectively). Values between the 3 genotypes were not significantly different (P = 0.57). The scale bar represents 1mm.
