
FIGURE 4.
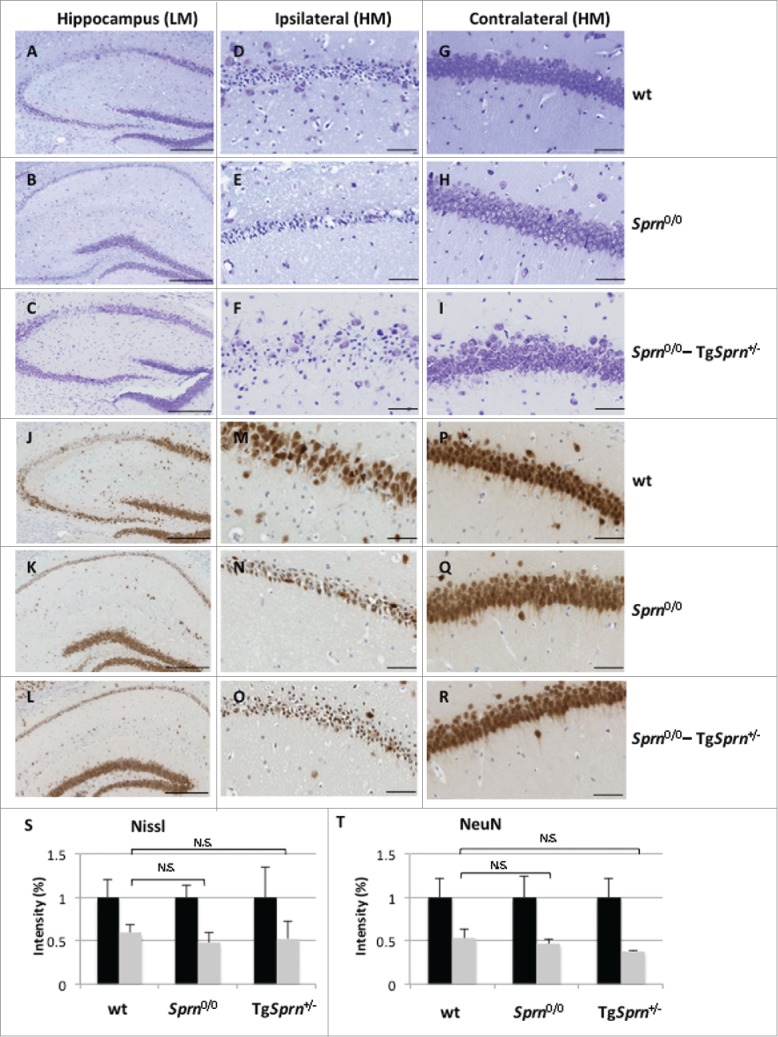
(see next page). Sprn genotypes and damage to the hippocampus. Nissl staining (A-I) and immunohistochemistry for NeuN (J-R) are represented. Low power fields of the hippocampal formation on the ipsilateral side of wt (A, J), Sprn0/0 (B, K) and Sprn0/0-TgSprn+/− mice (C, L) are shown in the left-hand column (scale bar represents 250 μm). The middle column represents a higher magnification of the CA2 region in the ipsilateral side of the infarct, whereas the right-hand column shows the contralateral side of the same region (scale bar represents 50 μm). Panels S and T represent staining intensity for Nissl and NeuN stain, respectively with the contralateral side shown as black bars (normalized to a value of 1.0, 100%) while gray bars represent the ipsilateral side. Sample sizes corresponded to n = 4, 3, 2 for Nissl staining and n = 3, 2, 3 for NeuN staining for wt, Sprn0/0 and Sprn0/0-TgSprn+/− genotypes, respectively. For Panels S and T the ipsilateral values for the 3 genotypes were not significantly different, p = 0.80 and p = 0.43. LM: low magnification, HM: high magnification.