Abstract
Rechargeable proton‐exchange membrane batteries that employ organic chemical hydrides as hydrogen‐storage media have the potential to serve as next‐generation power sources; however, significant challenges remain regarding the improvement of the reversible hydrogen‐storage capacity. Here, we address this challenge through the use of metal‐ion redox couples as energy carriers for battery operation. Carbon, with a suitable degree of crystallinity and surface oxygenation, was used as an effective anode material for the metal redox reactions. A Sn0.9In0.1P2O7‐based electrolyte membrane allowed no crossover of vanadium ions through the membrane. The V4+/V3+, V3+/V2+, and Sn4+/Sn2+ redox reactions took place at a more positive potential than that for hydrogen reduction, so that undesired hydrogen production could be avoided. The resulting electrical capacity reached 306 and 258 mAh g−1 for VOSO4 and SnSO4, respectively, and remained at 76 and 91 % of their respective initial values after 50 cycles.
Keywords: batteries, energy storage, fuel cells, proton-exchange membranes, redox chemistry
1. Introduction
Rechargeable fuel cells (RFCs) are energy storage and supply devices capable of operating alternately in electrolyzer and fuel‐cell modes,1 and are smaller and more compact than conventional systems with isolated water electrolyzer and fuel‐cell units. The primary application of RFCs is control of surplus power when the electric power produced by natural energy sources exceeds that required by an energy consumer.2 Thus, RFCs can compete with various secondary batteries, including lead–acid, redox‐flow, lithium‐ion, nickel–metal, and sodium–sulfur batteries.3 The key technology necessary for RFC application is hydrogen storage, which is currently carried out by liquefaction and compression of hydrogen, or through the physical and chemical adsorption of hydrogen atoms or molecules into materials such as activated carbon and metal or organic chemical hydrides.4 However, these processes require some external form of energy for hydrogen storage and release, which increases the electric power costs. Furthermore, the hydrogen tanks and lines required in RFC systems reduce their volumetric energy density.
To avoid the obstacles associated with these systems, rechargeable PEM batteries, which integrate a fuel cell with a hydrogen‐storage medium, have been proposed.5 To operate such batteries, a series of hydrogen production, storage, supply, and utilization processes must be conducted in the anode under fuel‐cell operating conditions (e.g. room temperature to 80 °C at ambient pressure). Quinones5b and partially oxygenated carbons5c are regarded as promising hydrogen‐storage media, owing to their excellent reversibility and good cyclability. The origin of hydrogen storage and release is attributed to the following equilibrium reaction between the two functional groups [Rection (1)]:6
| (1) |
This reaction determines the electrical capacity of proton‐exchange membrane (PEM) batteries, because the cathode operates by using oxygen and water vapor, which are abundant in the air [Reaction (2)]:
| (2) |
However, unlike the case for other batteries, no voltage plateau was observed during galvanostatic discharge. This is attributed to the dependence of the redox potential of Reaction (1) on the carbonyl‐/phenol‐containing species. Various types of carbonyl/phenol groups are present in quinone molecules and on the surface of oxygenated carbons.7 These functional groups are also electrochemically active over the wide potential window of 0–1.5 V;8 therefore, such redox reactions cannot provide the battery a fixed open‐circuit voltage (OCV). Both the low electrical capacity and large ohmic resistance of these hydrogen carriers, especially quinones, must also be addressed for practical applications.
As an alternative approach, high‐valence metal ion/low‐valence metal ion or metal redox couples are employed as energy carriers rather than hydrogen carriers. Based on the standard electrode potential,9 the following redox couples can be considered as candidate energy carriers for PEM batteries operating in acidic media [Reactions (3)–(3)]:
| (3) |
| (4) |
| (5) |
| (6) |
where protons migrate through the electrolyte membrane to control the charge balance between Reactions (3)–(5) and Reaction (2) during charging and discharging [Reaction (7)]:
| (7) |
It is worth noting that the two‐electron reactions, Reactions (3)–(5), would provide a higher electrical capacity than that for a one‐electron reaction, Reaction (1). Also, note that the ohmic resistance of the anode is easily reduced by the addition of a small quantity of conductive carbon to the electrode.
Herein, we investigate the performance of PEM batteries by using the above‐mentioned redox reactions as energy‐carrier media at room temperature. The goals of the present work were to 1) evaluate the electrocatalytic activity of the anode and cathode for the metal redox reaction and oxygen reduction and evolution reactions (ORRs and OERs), respectively, in solid‐state half‐cells with an air reference electrode,10 2) suppress the crossover of metal ions and oxygen molecules through the electrolyte membrane, 3) optimize the crystallinity and morphology of a carbon electrode to enhance the reversibility of the redox reaction, and 4) conduct galvanostatic charge–discharge and cyclability tests.
2. Results and Discussion
2.1. Electrochemical Kinetics of VOSO4/Acetylene Black (AB)
In situ cyclic voltammetry (CV) profiles for an AB‐supported VOSO4 electrode were first measured by attaching the electrode to a stainless‐steel current collector by using polytetrafluoroethylene (PTFE) tape. As shown in Figure 1 a, the CV curves exhibited redox peaks at E 1/2≈−0.8 V (vs. air reference) and a reduction peak that terminated at −2.0 V (vs. air reference), which are assigned to faradic reactions that take place according to Reaction (3) and to the evolution of hydrogen molecules, respectively. A very small electrostatic or pseudocapacitive oxidation peak was also observed between −1.0 and −1.5 V (vs. air reference), which may suggest that V2+ ions are oxidized to V3+, according to Reaction (4). The corresponding reduction reaction may start to take place simultaneously with the evolution of hydrogen molecules at −1.5 V or below (vs. air reference). As described later, relatively large redox peaks attributable to Reaction (4) are observed in the in situ CV profiles for the battery, as measured in two‐electrode mode. This discrepancy is likely caused by the poor sealability of the above half‐cell, because a portion of the electrolyte membrane was allowed to protrude through the tape from the half‐cell to air in order to attach the reference electrode. Another important result, shown in Figure 1 a, is the extreme asymmetry of the V3+/V4+ redox peaks in terms of shape and size, which may be caused by the irreversibility of this reaction. This can be further assessed by the following two findings. One is an increase in the separation between the reduction and oxidation peaks with increasing scan rate (Figure 1 b). The other is the nonlinear relationship observed between the peak current and the square root of the scan rate (Figure 1 c). These findings reflect the fact that the kinetics of the V3+/V4+ redox reaction is controlled by electron transfer between the vanadium ions and the AB electrode,11 which is supported by the electrochemical impedance spectroscopy (EIS) results (Figure 1 d). In the Nyquist plot, a semicircular arc, corresponding to the polarization resistance, was distinctly seen at intermediate frequencies. Details regarding the improvement in electrode activity will be discussed later.
Figure 1.
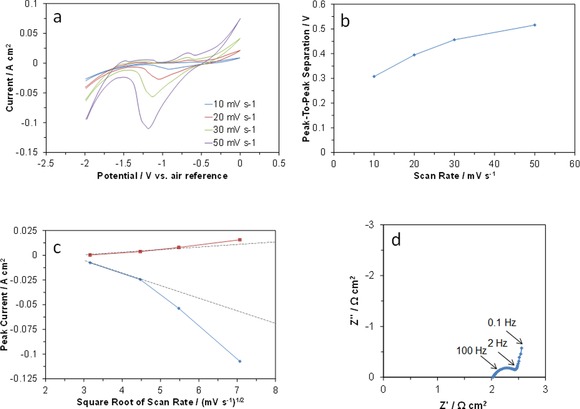
Electrode properties of VOSO4/AB. a) In situ CV curves at various scan rates. b) Peak‐to‐peak separation for the V4+/V3+ redox reaction as a function of scan rate. c) Anodic and cathodic peak currents for the V4+/V3+ redox reaction as a function of the square root of the scan rate. d) Impedance spectrum.
2.2. Electrochemical Kinetics of RuO2
RuO2 has been widely investigated as a replacement for platinum in electrolysis and fuel cells; however, most of these studies were carried out in acid solutions.12 To better understand the characteristics of the present RuO2 electrode in atmospheric air, various in situ electrochemical measurements were conducted by using the three‐electrode method. CV profiles measured in a potential window of ±0.3 V (vs. air reference) showed three distinctive changes with scan rate; both the anodic and cathodic currents increased at each potential, the shape varied from rectangular to ellipsoidal, and the slope angle increased to 45° or higher relative to the x axis (Figure 2 a). These findings are most likely caused by the occurrence of faradic reactions based on the ORR and OER during cathodic and anodic scans, respectively, because the associated voltage drop becomes larger as the scan rate increases, which distorts the rectangular CV curve at high scan rates.13 In our previous study, analysis of the outlet gas from the RuO2/C cathode showed that the H2O concentration decreased and the O2 concentration increased during charge, and vice versa during discharge,5c (see Figure S1 in the Supporting Information). Notably, the capacitive distribution shown in the CV profiles stayed symmetric at each scan rate with respect to the potential of the reference electrode (Figure 2 a), which indicates a similarity in the polarization resistance for the ORR and OER. Such a similarity was also found in two independent measurements: one of the electrode potentials with no IR correction during cathodic and anodic polarizations (Figure 2 b) and one of the impedances under negative and positive bias potentials (Figure 2 c). We, therefore, conclude that the RuO2 electrode exhibits high reversibility for the ORR and OER. This is further confirmed by the performance of the fuel and electrolysis cells with the RuO2 electrode; specifically, an almost linear relationship between the current density and cell voltage was maintained regardless of the polarity of the current sent through the cell (Figure 2 d).
Figure 2.
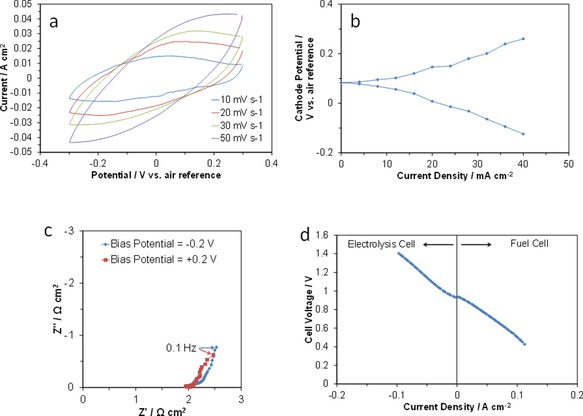
Electrode properties of RuO2. a) In situ CV curves at various scan rates. b) Cathode potentials during anodic and cathodic polarizations as a function of current density. The current density is expressed as an absolute value. c) Impedance spectra under negative and positive bias potentials. d) Current density–voltage curve for the cell operating in electrolysis and fuel‐cell modes.
2.3. Electrolyte Properties of the Sn0.9In0.1P2O7 (SIPO)–PTFE Composite Membrane
The ohmic resistance and gas permeation of the composite membrane with various thicknesses were evaluated to define the critical limit of thickness. The area‐specific resistance (ASR) of the membrane decreased almost linearly with thickness and reached a minimum of 1.6 Ω cm2 at 150 μm (Figure 3 a), which is indirect evidence for the homogenous distribution of SIPO particles in the matrix beyond this thickness.14 Negligibly small amounts of oxygen were detected through the 340 and 500 μm membranes, which implies that open pores are substantially absent in the composite sample. However, the gas penetration rate reached 0.22 μmol cm−2 s−1 at a thickness of 240 μm, below which the gas penetration rate increased to 1.27 μmol cm−2 s−1. Thus, a membrane thickness of 350 μm provided the best balance between conductivity and gas permeation of the membrane. Notably, this electrolyte membrane exhibited a lower ASR and superior gas barrier properties than a Nafion membrane examined under the same unhumidified conditions. The permeation of the electrolyte membrane to metal‐ion transfer is another important contributing factor to battery performance.15 The composition of the surface opposite the anode surface was measured by using energy‐dispersive X‐ray (EDX) analysis, and the results showed that no crossover of vanadium ions through the composite membrane was observed, in contrast to the Nafion membrane (Figure 3 b).
Figure 3.
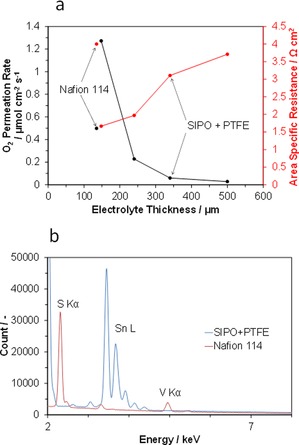
Electrolyte properties of SIPO–PTFE composite membrane. a) O2 penetration rate and ASR as a function of membrane thickness. b) EDX spectra of the opposite surface to the anode surface. For comparison, data for Nafion 114 are also included.
2.4. Charge and Discharge Characteristics: VOSO4/AB|SIPO–PTFE|RuO2
From the CV profiles (Figures 1 a and 2 a), the voltage window for battery operation was determined to be in the range of 0.0–1.5 V, because a charge voltage of 1.5 V is sufficiently large to reduce V4+ to V3+ or V2+. Moreover, the production of hydrogen molecules is avoided under such conditions. Galvanostatic charge–discharge profiles for the cells with the VOSO4/AB and AB anodes were measured with a current density of 10 mA cm−2 (Figure 4 a). The current could be drawn from the cell, even when no VOSO4 was present in the anode. This is not surprising, because an electrical double layer (EDL) is formed by charging the AB, which yields an electric capacity.16 The discharge time of the cell was drastically extended by the presence of VOSO4 in the anode. Plateau‐like behavior in the voltage was observed during charging and discharging; however, this effect was smaller than expected from the CV profiles. This is related to both the small amount of VOSO4 used (1.27 mg) and the large internal resistance of the cell (ca. 2.5 Ω cm2).
Figure 4.
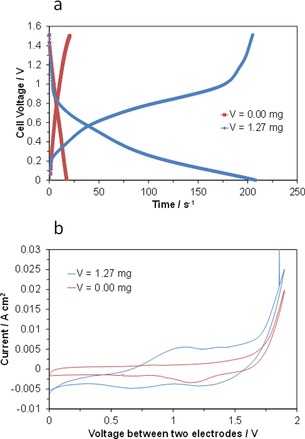
Electrochemical performance of VOSO4/AB|SIPO–PTFE|RuO2 fuel cells. a) Galvanostatic charge–discharge curves for fuel cells with and without VOSO4 in the anode at a current density of 10 mA cm−2. b) CVs for the cells with and without VOSO4 in the anode at a scan rate of 10 mV s−1.
The charge and discharge characteristics for the above batteries can be further interpreted through their in situ CV profiles measured in two‐electrode mode (Figure 4 b). A comparison between the two cells shows the presence of redox couples attributable to V4+/V3+ and V3+/V2+ around 1.0 and 1.2 V, respectively, which are lower than the threshold voltage for cathodic hydrogen evolution, which is around 1.6 V. Considering these results, together with the characteristics of each electrode (Figures 1 and 2), the following overall reaction of the present battery is possible [Reaction (8)]:
| (8) |
However, in the CV profile for the cell with the VOSO4/AB anode, the peak current was found to be lower for the V3+/V2+ redox reaction than for the V4+/V3+ redox reaction, which means that the former was not completed, whereas the latter was. For this reason, the capacity estimated from the discharge curve was 240 mAh g−1, which is just 73 % of the theoretical value.
2.5. Redesign of the Carbon Electrode
From the characterization results for each battery component, it is necessary to improve the battery performance to enhance the electrocatalytic activity of the carbon electrode for the redox reactions while suppressing the production of hydrogen molecules. We conducted screening tests using various types of carbon black as anode materials and found that CB2 showed the highest anode performance among the tested samples (see the Experimental Section). Transmission electron microscopy (TEM) observations revealed that the CB2 particles were nearly spherical and had smooth surfaces (Figure 5 a). The average primary particle size was estimated to be 37 nm, and the aggregate size was roughly 100–1000 nm. To gain insight into the factors affecting the catalytic activity for the redox reaction, the CB2 sample was modified by heat or acid treatment, followed by characterization of the products. The porosity of the three samples was investigated by using nitrogen adsorption–desorption isotherm measurements (Figure 5 b). CB2 had a type II isotherm, which is characteristic of mainly nonporous materials.17 The Brunauer–Emmett–Teller (BET) surface area was calculated to be 52 m2 g−1, which is similar to that for AB. The BET surface area was somewhat reduced by the heat treatment, but was not affected by the acid treatment. The crystallinity of the three samples was investigated by X‐ray diffraction (XRD), using a silicon internal standard (Figure 5 c). The 002 diffraction peak was enhanced and shifted to higher angles after the heat treatment. The resulting interlayer distance in carbon decreased from 3.618 Å (CB2 and acid‐treated CB2) to 3.490 Å (heat‐treated CB2). In contrast, the crystallite size (Lc) increased from 1.6 nm (CB2 and acid‐treated CB2) to 3.3 nm (heat‐treated CB2). The total content of acidic groups in the samples before and after the acid treatment was determined to be 0.0205 and 0.0258 mEq g−1, respectively, the difference of which is primarily attributed to the increase in the amount of carboxyl groups (Figure 5 d). A large decrease in the total content of acidic groups caused by the heat treatment is thought to be caused by thermal decomposition of carboxyl groups and by dehydrogenation of phenol groups.18 Thus, it is confirmed that the heat‐treated carbon sample has a far more graphite‐like structure than the other samples. Moreover, the acid‐treated carbon sample is partially oxygenated without significant structural deformation.
Figure 5.
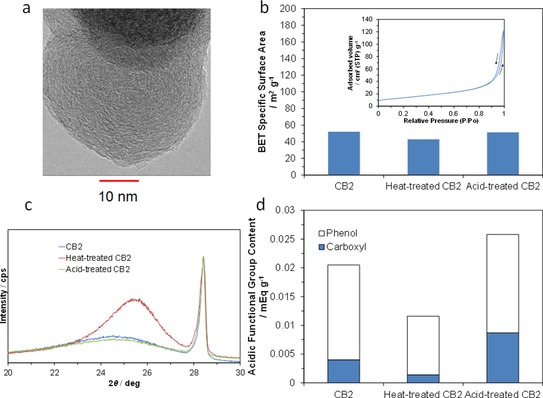
Characterization of untreated and treated carbon black. a) TEM image. b) BET specific surface areas. c) XRD patterns. d) Acidic functional group contents.
2.6. Charge and Discharge Characteristics: VOSO4/CB2|SIPO–PTFE|RuO2
The batteries with the untreated and treated CB2 anodes were charged and then discharged at a current density of 10 mA cm−2 (Figure 6 a). Modification of the carbon sample led to an enhancement of the charge voltage and a reduction of the discharge voltage over the entire range of electrical capacity. Furthermore, an abrupt increase in the charge voltage occurred above 1 V for the heated‐ and acid‐treated anodes. Consequently, the cell with the untreated CB2 anode exhibited the highest electrical capacity of 306 mAh g−1, which corresponds to 93 % of the theoretical value.
Figure 6.
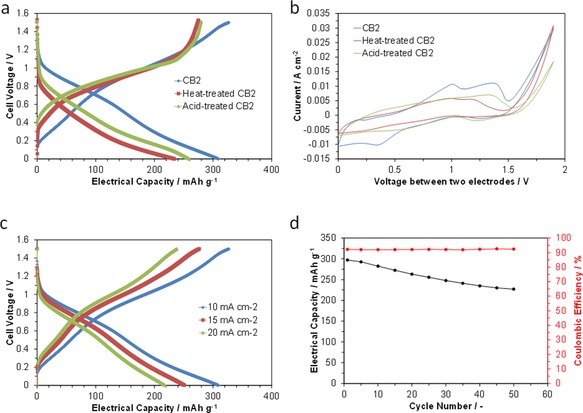
Electrochemical performance of VOSO4/CB2|SIPO–PTFE|RuO2 fuel cells. a) Galvanostatic charge–discharge curves for cells with untreated, heat‐treated, and acid‐treated CB2 at a current density of 10 mA cm−2. b) CV curves for cells with untreated, heat‐treated, and acid‐treated CB2 at a scan rate of 10 mV s−1. c) Galvanostatic charge–discharge curves for various current densities. d) Electrical capacity and coulombic efficiency as a function of cycle number, where the current density was set to 10 mA cm−2.
To determine the effect responsible for the electrical capacity of the present battery, CV profiles for the three cells were obtained in two‐electrode mode (Figure 6 b). The cell with the CB2 anode exhibited distinct V4+/V3+ and V3+/V2+ reduction peaks around 1.0 and 1.3 V, respectively, although the corresponding oxidation peaks were not clearly visible. In contrast, the difference between the two peaks was not measurable for the cells with the heat‐ and acid‐treated CB2 anodes. Moreover, each peak current was significantly reduced by these modifications. It is reasonable to conclude that graphitization of carbon black is ineffective in catalyzing metal redox reactions, because the amount of defects that function as active adsorption or reaction sites is decreased. However, in most cases for redox‐flow batteries, acidic functional groups enhance the activity of the carbon black by improving the wettability of the carbon surface,19 which is inconsistent with the findings obtained for the acid‐treated CB2 anode. One possible explanation is the change in the ohmic resistance of the cell, which increased from 2.9 to 3.5 Ω upon acid treatment of CB2. It is speculated that the carboxyl groups, which are abundant in acid‐treated CB2, are among the least conductive functional groups, and this leads to poor electrical contact between the carbon particles.20 In addition, the effect of the wettability on the electrode activity may be very small in the present battery. It should be noted that the active anode material is captured by the electrode (non‐flow type), as opposed to flowing through the electrode (flow type).
The influence of the current density on the charge–discharge properties of the cell with the CB2 anode material was investigated for current densities of 10–20 mA cm−2 (Figure 6 c). The present battery demonstrated charge–discharge processes with coulombic efficiencies over 90 % in the tested current density range. Meanwhile, the increased current density led to a decrease in the electrical capacity, because the voltage rise/drop during charging/discharging also increased with increasing current density. An additional contributing factor is that the anode potential that was accumulated by charging the cell decreases with increasing current density, because the charge voltage is the sum of the accumulated electrode potential, resistive loss, and overpotential, and the latter two become larger as the current density increases.
The cyclability of the cell was evaluated by using galvanostatic charge–discharge measurements. In all tests, no significant overshoots beyond 1.5 V upon charging at 10 mA cm−2 or under 0 V upon discharging at 10 mA cm−2 were observed. Although coulombic efficiencies greater than 90 % were obtained for the charge–discharge cycles, the capacity continuously decreased as the cycle number increased (Figure 6 d). Nevertheless, 76 % of the initial performance was retained after 50 cycles. One of the causes of the lowered cyclability is degradation of the cathode, because the electrical capacity recovered to approximately 90 % of its initial value upon replacement of the cathode in the test cell. Ruthenium tetroxide (RuO4) is reported to be formed during oxygen evolution.21 This oxide also more readily dissolves in acidic electrolytes than RuO2,22 which would reduce the activity of the cathode as the number of cycles increases. This problem may be avoided by using porous carbons doped with heteroatoms (such as N, B, P, and S) and metal oxide–nanocarbon composites as alternative cathodes.23 Compared to RuO2, these electrodes are more active for the ORR and are more stable in acidic media during the OER.
2.7. Charge and Discharge Characteristics: SnSO4 or NiSO4/CB2|SIPO–PTFE|RuO2
To assess whether similar charge and discharge processes could occur for SnSO4 and NiSO4 active anode materials, galvanostatic charge–discharge measurements were performed by using the same cell components as those shown above. The cell with the SnSO4/CB2 anode operated as a reversible battery with an electrical capacity of 258 mAh g−1, although the coulombic efficiency was 85 % (Figure 7 a). This cell also maintained an electrical capacity of 236 mAh g−1 after 50 cycles (data not shown). Analysis of the in situ CV profile revealed the presence of two redox couples at 0.92 and 1.23 V, which are assigned to Sn4+/Sn2+ and Sn2+/Sn, respectively (Figure 7 b). However, the CV profiles also showed that that the peak current for the latter was lower than that for the former, which suggests that the contribution of the latter to the battery performance is small, contrary to expectations. On the other hand, NiSO4 did not function as an energy‐storage medium (Figure 7 a). It is likely that an electrical capacity of only 15 mAh g−1 is obtained by the formation of an EDL, as indicated by the poorly developed or non‐existent peak in the in situ CV profile (Figure 7 b). Also taking into account the low Sn2+/Sn peak current, it is speculated that the presence of acidic functional groups on the surface of CB2 are undesirable for the electrochemical deposition of Sn and Ni metals, unlike the reduction to V2+ and Sn2+. Further research is required to optimize the anode material of the present battery.
Figure 7.
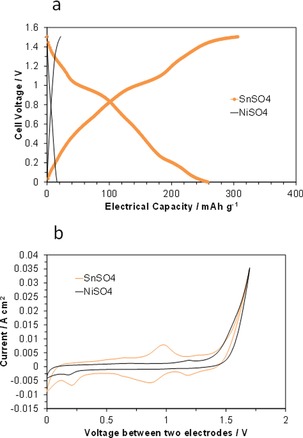
Electrochemical performance of SnSO4/CB2 and NiSO4/CB2|SIPO–PTFE|RuO2 fuel cells. a) Galvanostatic charge–discharge curves for the cells at a current density of 10 mA cm−2. b) CV curves for the cells at a scan rate of 10 mV s−1.
3. Conclusions
PEM batteries have been developed by using VOSO4 and SnSO4 as energy‐storage media. By charging the cell at 1.5 V, vanadium or tin ions were reduced to lower valence ions without hydrogen production, which was accompanied by the simultaneous oxidation of water molecules to oxygen molecules and protons. The discharge of the cell proceeded based on the reverse reactions. The SIPO–PTFE composite membrane showed a lower ASR and higher barrier ability for gas and metal ions compared to Nafion 114. RuO2 reversibly functioned as an air electrode for the OER and ORR, although its acid resistance was not high enough. Consequently, the performance of the present battery was strongly dependent upon the crystallinity and the surface oxygenation of the carbon used as the anode material. The battery with an anode material that met such criteria had electrical capacities of 306 and 258 mAh g−1 for VOSO4 and SnSO4, respectively. The capacity degradation of 10–25 % that occurs after 50 cycles was mainly attributed to the instability of the cathode at high charge voltages.
Experimental Section
SIPO was selected as the electrolyte material, because this material has a proton conductivity of approximately 0.05 S cm−1 without the need for excess humidification, as reviewed elsewhere.24 The electrolyte membrane was prepared by mixing SIPO powder (1.00 g) with PTFE powder (0.04 g) in a mortar, followed by cold‐rolling the mixture to a thickness of 150–500 μm by using a laboratory rolling mill.
The carbon black (Asahi Carbon CB2) used for the anode material was modified according to different procedures. One sample was heat treated at 1600 °C in vacuum for 1 h by using an electric furnace. The other sample was acid treated as follows. First, the carbon (1 g) was stirred in 24 wt % HNO3 (50 mL) at room temperature for 48 h. After filtering and washing, the resultant product was dried under vacuum at 120 °C for 6 h. For comparison, AB (Wako Chemicals) was also examined as an anode material. The active anode materials were 0.25 m VOSO4, 0.25 m SnSO4, and 0.25 m NiSO4 in 1 m H2SO4. In this case, the carbon (0.1 g) was dispersed with the active material (ca. 0.5 g) by using a mixer (Thinky AR‐100) for 40 min. The obtained slurry was deposited on the surface of carbon fiber paper (Toray TGP‐H‐090). RuO2 (Aldrich) was employed as the cathode material. After the addition of a small amount of H3PO4, the electrode slurries were coated on the carbon fiber paper in a similar manner to that used for the anode. The anode and cathode loadings were adjusted to approximately 28 and 12 mg cm−2, respectively.
Characterization
The permeability of the membrane samples to oxygen was determined by using two chambers separated by the membrane. Air and pure argon were supplied to each chamber at a flow rate of 60 mL min−1, and the permeation of oxygen to the argon chamber was monitored by using a gas chromatograph (Varian CP‐4900) equipped with a thermal conductivity detector. The permeability of an optimized membrane sample to vanadium ions from the anode to the cathode was also determined by using an EDX spectrometer installed in a scanning electron microscope (Jeol JSM‐6610 A).
The microstructure of the carbon samples was examined by using TEM (Jeol JEM2100F) at an accelerating voltage of 200 kV and a beam current of 92 μA. The pore characteristics of the carbon samples were analyzed by nitrogen adsorption at liquid‐nitrogen temperature (Bel Japan BELSORP18PLUS‐HT), and the specific surface areas were calculated by using the BET method. The degree of crystallinity for the carbon samples was estimated by using an X‐ray diffractometer (Rigaku Miniflex II) at 45 kV and 20 mA with CuKα radiation (λ=1.5418 Å). The quantity of functional groups for the carbon samples was measured according to the method suggested by Boehm.25 NaOH and NaHCO3 were used as reaction reagents to measure the total number of acidic groups (phenol and carboxyl groups) and the number of carboxyl groups, respectively. For example, 0.05–1.00 g of sample was placed in a vessel, to which 50 mL of 0.004 N NaOH was added. After stirring at 100 °C for 2 h and filtering, the solution was back‐titrated with 0.002 N HCl. The number of phenol groups was assumed to be the difference between the NaOH and NaHCO3 consumed.
Electrochemical Measurements
Membrane electrode assemblies (MEAs) were fabricated by sandwiching the electrolyte membrane between two electrodes (0.5 cm2). In situ CV measurements for the VOSO4/C and RuO2 working electrodes were conducted in three‐electrode mode, where a commercially available Pt/C electrode (40 wt % Pt, ElectroChem) was used as both the counter and reference electrodes. For both measurements, the reference electrode was exposed to atmospheric air with a relative humidity of approximately 50 %. Voltammograms for the VOSO4/C electrode were obtained for an MEA with atmospheric air (30 mL min−1) supplied to the counter electrode, whereas those for the RuO2 electrode were recorded for an MEA with hydrogen (30 mL min−1) supplied to the counter electrode. On the other hand, in situ CV measurements for batteries with the VOSO4, SnSO4, or NiSO4/C anodes and the RuO2 cathode were performed in two‐electrode mode. The scan rate was set in the range of 10–50 mV s−1 for three‐electrode mode and at 10 mV s−1 for two‐electrode mode. The ohmic and polarization resistances were analyzed by using an impedance analyzer (Solartron SI 1260) and an electrochemical interface (Solartron 1287) in the frequency range of 0.1–106 Hz. The electrical capacity was obtained from galvanostatic charge–discharge measurements at room temperature with the current density and discharge–charge voltage set in the ranges of 10–20 mA cm−2 and 0.0–1.5 V, respectively. The voltage during charging and discharging was monitored by using the impedance analyzer.
Supporting information
As a service to our authors and readers, this journal provides supporting information supplied by the authors. Such materials are peer reviewed and may be re‐organized for online delivery, but are not copy‐edited or typeset. Technical support issues arising from supporting information (other than missing files) should be addressed to the authors.
Supplementary
Acknowledgements
This work was supported by the Japan Society for the Promotion of Science JSPS KAKENHI, Grant Numbers 26000008 and 25288106.
M. Nagao, K. Kobayashi, Y. Yamamoto, T. Yamaguchi, A. Oogushi, T. Hibino, ChemElectroChem 2016, 3, 247.
References
- 1.
- 1a. Agbossou K., Chahine R., Hamelin J., Laurencelle F., Anouar A., St-Arnaud J. M., Bose T. K., J. Power Sources 2001, 96, 168–172; [Google Scholar]
- 1b. Zoulias E. I., Lymberopoulos N., Renewable Energy 2007, 32, 680–696; [Google Scholar]
- 1c. Yilanci A., Dincer I., Ozturk H. K., Prog. Energy Combust. Sci. 2009, 35, 231–244; [Google Scholar]
- 1d. Park S., Shao Y., Liu J., Wang Y., Energy Environ. Sci. 2012, 5, 9331–9344; [Google Scholar]
- 1e. Goñi-Urtiaga A., Presvytes D., Scott K., Int. J. Hydrogen Energy 2012, 37, 3358–3372. [Google Scholar]
- 2.
- 2a. Baldwin R., Pham M., Leonida A., McElroy J., Nalette T., J. Power Sources 1990, 29, 399–412; [Google Scholar]
- 2b. Mitlitsky F., Myers B., Weisberg A. H., Energy Fuels 1998, 12, 56–71; [Google Scholar]
- 2c. Ioroi T., Yasuda K., Siroma Z., Fujiwara N., Miyazaki Y., J. Power Sources 2002, 112, 583–587. [Google Scholar]
- 3. Perrin M., Saint-Drenan Y. M., Mattera F., Malbranche P., J. Power Sources 2005, 144, 402–410. [Google Scholar]
- 4.
- 4a. Eberle U., Felderhoff M., Schüth F., Angew. Chem. Int. Ed. 2009, 48, 6608–6630; [DOI] [PubMed] [Google Scholar]; Angew. Chem. 2009, 121, 6732–6757; [Google Scholar]
- 4b. Graetz J., Chem. Soc. Rev. 2009, 38, 73–82. [DOI] [PubMed] [Google Scholar]
- 5.
- 5a. Kariya N., Fukuoka A., Ichikawa M., Phys. Chem. Chem. Phys. 2006, 8, 1724–1730; [DOI] [PubMed] [Google Scholar]
- 5b. Nagao M., Kobayashi K., Yamamoto Y., Hibino T., J. Electrochem. Soc. 2015, 162, F410–F418; [Google Scholar]
- 5c. Kobayashi K., Nagao M., Yamamoto Y., Heo P., Hibino T., J. Electrochem. Soc. 2015, 162, F868–F877. [Google Scholar]
- 6. Revenga J., Rodriguez F., Tijero J., J. Electrochem. Soc. 1994, 141, 330–333. [Google Scholar]
- 7. Fuente E., Menendez J. A., Suarez D., Montes-Morán M. A., Langmuir 2003, 19, 3505–3511. [Google Scholar]
- 8.
- 8a. Ohashi A., Aida T., Tsunetsugu J., J. Mol. Struct. 1994, 324, 75–82; [Google Scholar]
- 8b. Andreas H. A., Conway B. E., Electrochim. acta 2006, 51, 6510–6520. [Google Scholar]
- 9. Ahmad Z., Principles of Corrosion Engineering and Corrosion Control, Elsevier, Oxford, 2006, pp. 281–304. [Google Scholar]
- 10.
- 10a. Iwahara H., Yajima T., Hibino T., Ushida H., J. Electrochem. Soc. 1993, 140, 1687–1691; [Google Scholar]
- 10b. Heo P., Shibata H., Nagao M., Hibino T., Sano M., J. Electrochem. Soc. 2006, 153, A897–A901; [Google Scholar]
- 10c. Genzaki K., Heo P., Sano M., Hibino T., J. Electrochem. Soc. 2009, 156, B806–B810. [Google Scholar]
- 11. Gosser D. K., Cyclic Voltammetry Simulation and Analysis of Reaction Mechanism, Wiley VCH, New York, 1994. [Google Scholar]
- 12.
- 12a. Damjanovic A., Dey A., Bockris J. O. M., J. Electrochem. Soc. 1966, 113, 739–746; [Google Scholar]
- 12b. Gottesfeld S., Srinivasan S., J. Electroanal. Chem. 1978, 86, 89–104; [Google Scholar]
- 12c. Lodi G., Sivieri E., Debattisti A., Trasatti S., J. Appl. Electrochem. 1978, 8, 135–143. [Google Scholar]
- 13.
- 13a. Lee J. Y., Liang K., An K. H., Lee Y. H., Synth. Met. 2005, 150, 153–157; [Google Scholar]
- 13b. Lee D., Jung J. Y., Jung M. J., Lee Y. S., Chem. Eng. J. 2015, 263, 62–70. [Google Scholar]
- 14. Jin Y. C., Shen Y. B., Hibino T., J. Mater. Chem. 2010, 20, 6214–6217. [Google Scholar]
- 15. Teng X., Zhao Y., Xi J., Wu Z., Qiu X., Chen L., J. Membr. Sci. 2009, 341, 149–154. [Google Scholar]
- 16.
- 16a. Kötz R., Carlen M., Electrochim. Acta 2000, 45, 2483–2498; [Google Scholar]
- 16b. Zhang L. L., Zhao X. S., Chem. Soc. Rev. 2009, 38, 2520–2531; [DOI] [PubMed] [Google Scholar]
- 16c. Hibino T., Kobayashi K., Nagao M., Kawasaki S., Sci. Rep. 2015, 5, 7903. [DOI] [PMC free article] [PubMed] [Google Scholar]
- 17. Do D. D., Adsorption Analysis: Equilibria and Kinetics, Imperial College Press, London, 1998. [Google Scholar]
- 18. Zhang Z., Lussier M. G., Miller D. J., Carbon 2000, 38, 1289–1296. [Google Scholar]
- 19.
- 19a. Sun B., Skyllas-Kazacos M., Electrochim. Acta 1992, 37, 1253–1260; [Google Scholar]
- 19b. Li W., Liu J., Yan C., Carbon 2013, 55, 313–320. [Google Scholar]
- 20.
- 20a. Pantea D., Darmstadt H., Kaliaguine S., Sümmchen L., Roy C., Carbon 2001, 39, 1147–1158; [Google Scholar]
- 20b. Sebastián D., Suelves I., Moliner R., Lázaro M. J., Carbon 2010, 48, 4421–4431. [Google Scholar]
- 21.
- 21a. Kötz R., Stucki S., Scherson D., Kolb D. M., J. Electroanal. Chem. 1984, 172, 211–219; [Google Scholar]
- 21b. Mamaca N., Mayousse E., Arrii-Clacens S., Napporn T. W., Servat K., Guillet N., Kokoh K. B., Appl. Catal. B 2012, 111, 376–380. [Google Scholar]
- 22. Chan H. Y. H., Takoudis C. C., Weaver M. J., J. Catal. 1997, 172, 336–345. [Google Scholar]
- 23.
- 23a. Wang Z. L., Xu D., Xu J. J., Zhang X. B., Chem. Soc. Rev. 2014, 43, 7746–7786; [DOI] [PubMed] [Google Scholar]
- 23b. Zhong H., Wang J., Zhang Y., Xu W., Xing W., Xu D., Zhang Y., Zhang X., Angew. Chem. Int. Ed. 2014, 53, 14235–14239; [DOI] [PubMed] [Google Scholar]; Angew. Chem. 2014, 126, 14459–14463; [Google Scholar]
- 23c. Wang J., Li K., Zhong H., Xu D., Wang Z., Jiang Z., Wu Z., Zhang X., Angew. Chem. Int. Ed. 2015, 54, 10530–10534; [DOI] [PubMed] [Google Scholar]; Angew. Chem. 2014, 127, 10676–10680. [Google Scholar]
- 24.
- 24a. Paschos O., Kunze J., Stimming U., Maglia F., J. Phys. Condens. Matter 2011, 23, 234110–234136; [DOI] [PubMed] [Google Scholar]
- 24b. Hibino T., J. Ceram. Soc. Jpn. 2011, 119, 677–686; [Google Scholar]
- 24c. Scott K., Xu C., Wu X., WIREs Energy Environ. 2014, 3, 24–41. [Google Scholar]
- 25. Boehm H. P., Carbon 1994, 32, 759–769. [Google Scholar]
Associated Data
This section collects any data citations, data availability statements, or supplementary materials included in this article.
Supplementary Materials
As a service to our authors and readers, this journal provides supporting information supplied by the authors. Such materials are peer reviewed and may be re‐organized for online delivery, but are not copy‐edited or typeset. Technical support issues arising from supporting information (other than missing files) should be addressed to the authors.
Supplementary


