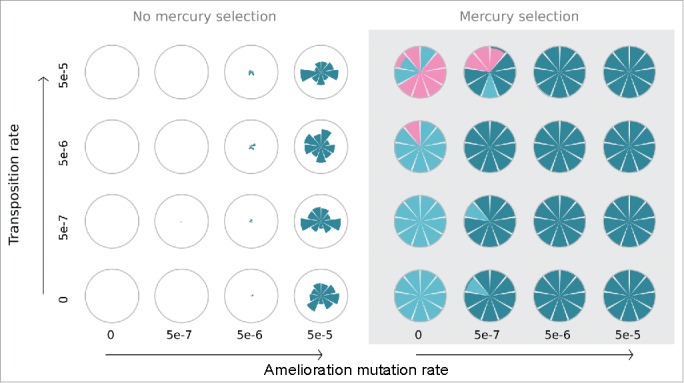
Figure 3.

The impact of amelioration and transposition rate on the outcome of the IBM. Models were run across a range of amelioration mutation (x axis) and transposition (y axis) rates in the presence (right panel) and absence (left panel) of mercury selection. Nine individual iterations of the IBM were run for each combination of parameters. The composition of each population after 251 generations of the IBM is represented by each sector of a circle. Shading shows the proportion of plasmid-carrying genotypes (blue), compensatory mutations (dark blue) and plasmid-free, transposon-carrying (red) genotypes.
