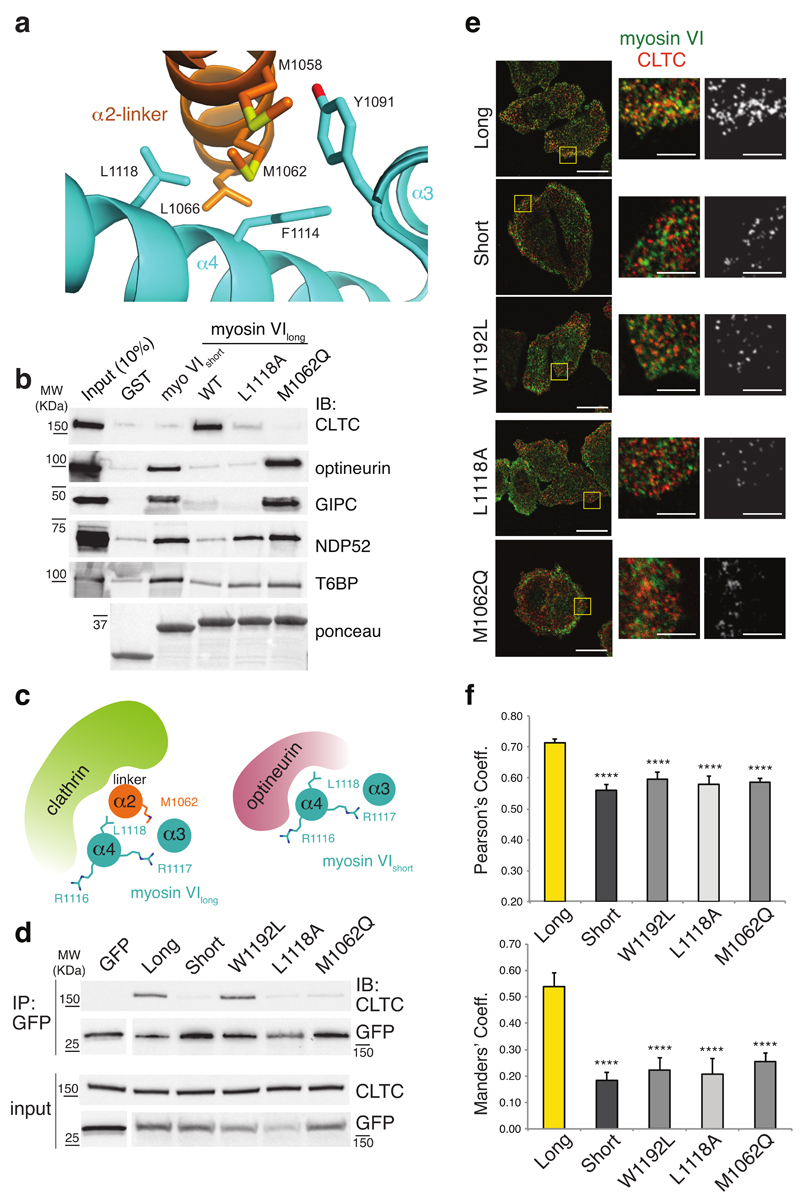
Figure 4. Myosin VI isoforms have mutually exclusive interactors.
(a) Expanded view of the myosin VI R1050–R1131 structure that illustrates the interaction surface between α2-linker and α3/α4 and highlights M1062 and L1118. (b) GST pull-down assay with the myosin VI1080–1131 and lysates from HEK293T cells transfected with GFP-optineurin, Flag-NDP52, His-GIPC, Flag-T6BP1 constructs. Ponceau as indicated. (c) Model representation of myosin VIlong–clathrin (left panel) and myosin VIshort–optineurin (right panel) interaction. (d) Immunoprecipitation (IP) analysis of HeLa cells stably knocked down for myosin VI transfected with the indicated GFP-myosin VI full-length constructs. IP and IB as indicated. (e) Immunofluorescence analysis of HeLa cells stably knocked down for myosin VI transfected as in d. Endogenous CLTC is in red. Scale bars, 20µm, 5 µm for magnifications. Right panels show co-localization generated by ImageJ plugin colocalization highlighter (pseudocolored in grey). (f) Quantification of the co-localization using Pearson’s and Manders’ coefficients. Error bars, s.d. (n= 15 cells from two independent experiments) **** P<0.0001 by two-tailed T-test.

