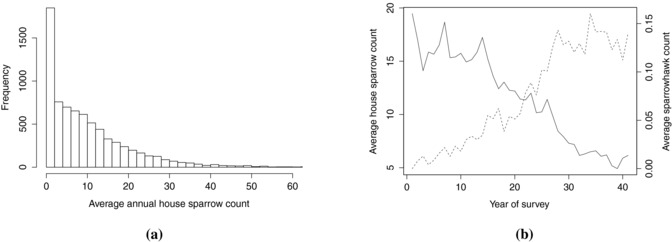
Figure 2.

(a) Distribution of year‐by‐site averages of house sparrow counts from 1970–2010, clearly showing the problems of zero‐inflation and the right‐skewed nature of the positive observations. The histogram shows values only up to 60; there are an additional 36 observations above 60 with a maximum of 132.8. (b) Yearly averages of number of house sparrows (solid line) and sparrowhawks (broken line) observed across GBFS sites.
