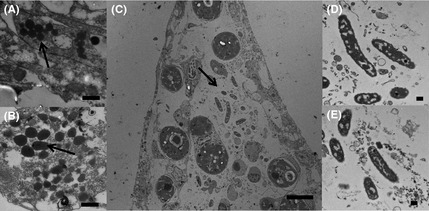
Figure 3.

Transmission electron micrographs of the coral Acropora muricata; A and B shows possible bacterial associates (arrows) seen in all the tissues in all treatments: (A) an example of healthy tissues and (B) an example of WS‐affected samples (Scale Bar = 500 nm). (C) Illustrates the tissues of WS‐affected corals treated with metronidazole, showing the presence of a different type of rod‐shaped bacteria associated with disrupted tissues (Scale Bar 10 μm). These particular bacteria were only observed to be associated with metronidazole‐treated WS samples (D & E; Scale Bar 500 nm).
