
Figure 4.
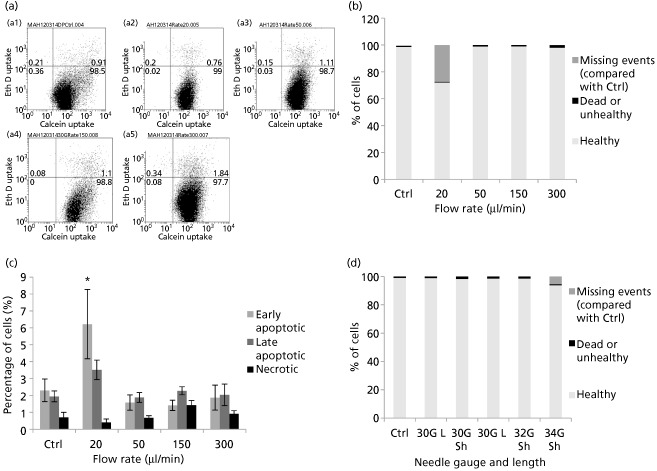
(a) Flow cytometric dot plot quadrant analysis of NIH 3T3 cells, using Live/Dead stain, (a1) directly plated or ejected at (a2) 20, (a3) 50, (a4) 150 or (a5) 300 μl/min. (b) Graph showing results of flow cytometric analysis of NIH 3T3 cells ejected at various flow rates, classified as healthy, dead/unhealthy or missing events (compared with control). (c) Percentages of apoptotic and necrotic cells were analysed by flow cytometric analysis of NIH 3T3 cells 48‐h post‐injection, by double labelling with Alexa Fluor 488 Annexin V and propidium iodide (PI). Mean values of five independent experiments are shown ± SEM. Asterisk represents significant difference between samples and control using two‐way ANOVA followed by Tukey's post‐hoc test. (d) Graph showing results of flow cytometric analysis of NIH 3T3 cells ejected using various needle gauges and lengths, classified as healthy, dead/unhealthy or missing events (compared with control).