
Figure 6.
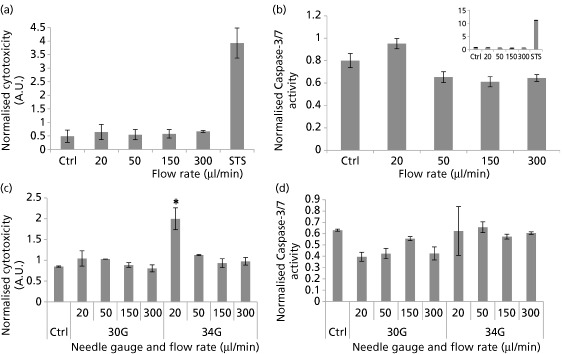
(a) Cytotoxicity in NIH 3T3 cells 4‐h post‐injection (analysed by ApoTox‐Glo Triplex Assay). Cytotoxicity fluorescence at wavelengths 485EXT and 520EM were normalised to viability within the same well. (b) Caspase‐3/7 activity luminescence was represented as normalised to viability in well‐to‐well normalisation. Staurosporine treatment (1 μM) was used as a positive control, and the graph showing its effect is superimposed for clarity (n = 3; mean ± SEM). (c) Cytotoxicity in NIH 3T3 cells 4‐h post‐injection (analysed by ApoTox‐Glo Triplex Assay). Cytotoxicity readings were normalised to viability within the same well. (d) Caspase‐3/7 activity luminescence was represented as normalised to viability measurements. Asterisks represent significant difference between sample and control (P < 0.05). (n = 2; mean ± SEM).