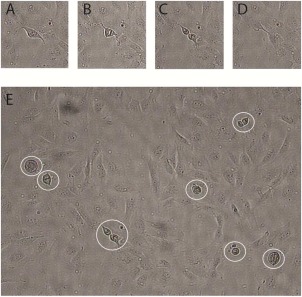
Figure 1.

A–D: Representative time series, of reduced image field size, showing a single cell division event imaged at 15 min intervals; (E) full image field with mitotic cells highlighted with overlaid circles. All images are of BEAS‐2B cells seeded at a density of 2 × 10⁵ cells ml−1.
