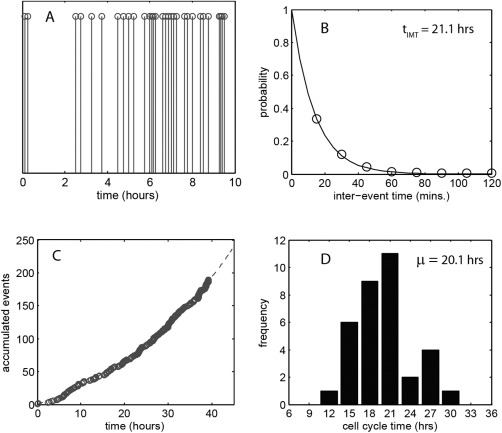
Figure 2.

A: Time series of division events for an A549 cell culture, seeded at a density of 1.5 × 10⁵ cells ml−1. An expanded view of the first 10 h of a 40 h time‐lapse experiment is shown to ensure clear display of events. B: Probability distribution of the interevent time for all events within the 40 h period (circles – measurement data, solid line – statistical fit). The t IMT value indicated is obtained by a best fit to the data assuming a nonhomogeneous Poisson process. C: Accumulated count of cell division events (circles) with a model prediction (dashed line) based on exponential population growth. D: Histogram of measured cell cycle time obtained from manual, frame‐by‐frame tracking of 34 cells through their cycle.
