
Figure 7.
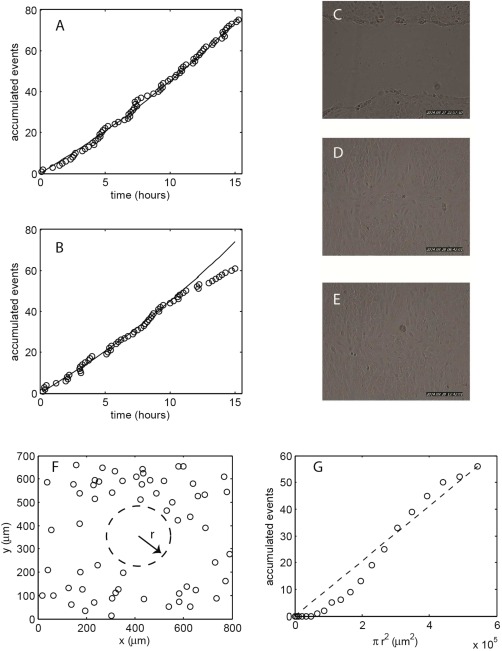
A: Accumulated mitotic events for BEAS‐2B cells over a 15 h period prior to a scratch assay. B: Accumulated mitotic events for the 15 h immediately following creation of a scratch in the cell layer. C–E: Image frames acquired at 0, 10, and 15 h following creation of the scratch. F: Spatial map of the mitotic events shown in B. The dashed circle indicates the position of the variable area used for counting of spatial events. G: Spatial accumulation of mitotic events shown in B.