
Figure 3.
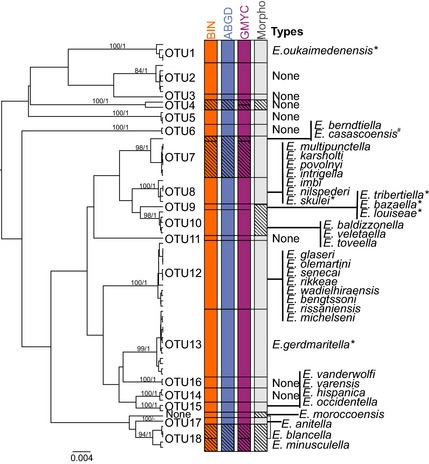
A Bayesian inference tree used for OTU delineation via GMYC (includes >400‐bp sequences) with bootstrap (from RAxML analysis) and posterior probability values (on the left). Coloured bars indicate delineated OTUs by different methods (Barcode Index Numbers BIN, Automatic Barcode Gap Discovery ABGD, General Mixed Yule‐coalescent GMYC and morphology) (in the middle). ‘Types’ includes all DNA barcodes of type specimens associated with OTUs in this study (on the right). Types marked with * have controversial results based on either conflicting results between the used methods or rather long distance to the nearest OTU (see text for further information). E. casascoensis (marked with #) is placed according to the distance measures, BLOG results and morphology as none of the tree‐based methods associated E. casascoensis with any OTU.