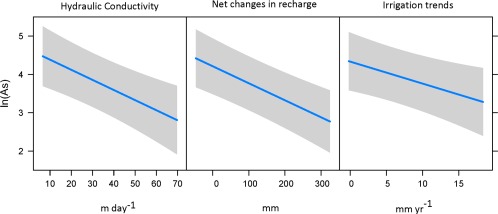
Figure 4.

Modeled effects of key covariates: hydraulic conductivity, net changes in recharge, and irrigation trends on As concentrations in the national‐scale, final GRM. On each plot, the vertical axis is labeled as contribution to the natural logarithm of expected As concentration, the horizontal axis denotes measurement unit for each covariate, and a 95% pointwise confidence interval is drawn around the estimated effect. Note: relationships for hydraulic conductivity and net changes in recharge are statistically significant (LR‐test P values < 0.05), whereas the relationship for irrigation trends is of borderline significance (LR‐test P value of 0.06).
