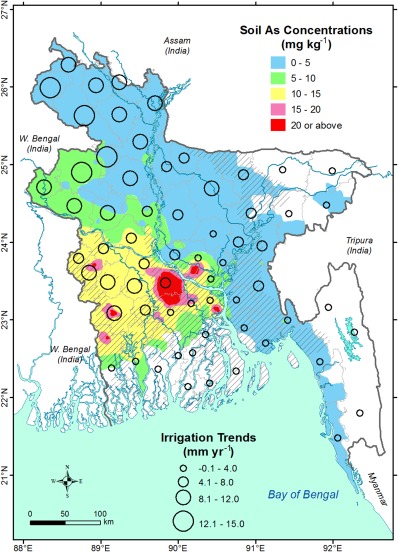
Figure 5.

Average groundwater‐fed irrigation trends (mm yr−1) for the period of 1985–1999 in each districts (n = 64) in Bangladesh. The background map shows observed soil (depth 0−15 cm bgl) As concentrations surveyed and interpolated from a total of 394 sampling points reported in Duxbury and Panaullah [2007]. Areas in Bangladesh where As concentrations in groundwater are >50 μg L−1 are shown as hatched symbol.
