
Figure 4.
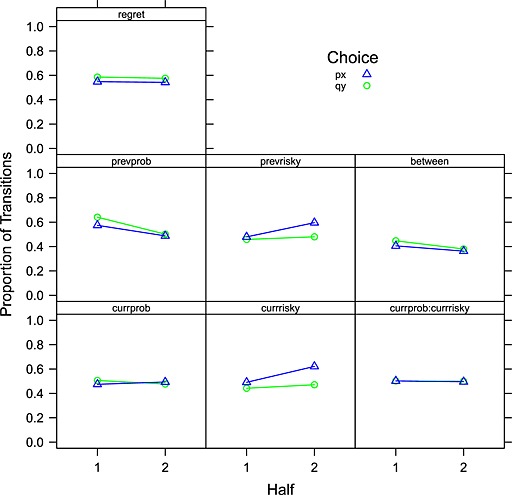
The development of the transition matrix over time, conditional on the final choice. The proportion of transitions of a particular type is plotted for the first and second half of each choice. Trials are split by the final choice. Each panel plots the development of a different type of transition