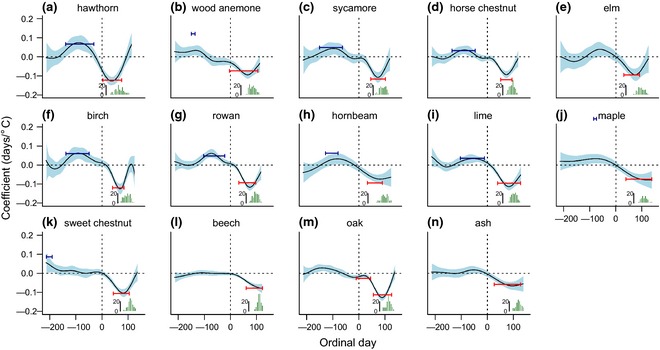
Figure 1.

Predicted coefficients (black line) from P‐spline signal regression model (see Materials and methods) for the effect of daily temperatures during the preceding and current year on phenology of the fourteen species (a‐n). Ordinal dates start on Jan 1st in the year of the event and ordinal dates with a value <1 refer to the previous year. The light blue region indicates 95% approximate confidence intervals on individual coefficients. Histograms present the temporal distribution of observations for each event in the Marsham record. The red (forcing) and blue (chilling) horizontal bar identify the time period(s) identified using the sliding‐window approach, with the bar position on the y axis = average coefficient over the time window.
