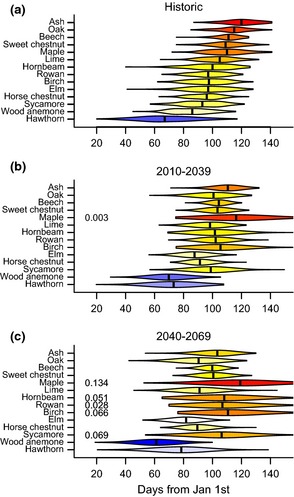
Figure 3.

Violin plots of the distribution of spring events in (a) the Marsham dataset and projected for (b) 2010–2039 and (c) 2040–2069. Projections are based on the mechanistic model with the lowest AIC value. They capture modeled uncertainty both in temperature change and phenology model parameters, as well as baseline levels of year‐to‐year variation in temperature (see Materials and methods). Numeric values to the left of violins report the proportion of projections that resulted in no event by ordinal day 250. Median (excluding cases where no event was predicted) phenology is shown as a black vertical line. Colors correspond to the position of each species’ median on a gradient from early (blue) to late (red).
