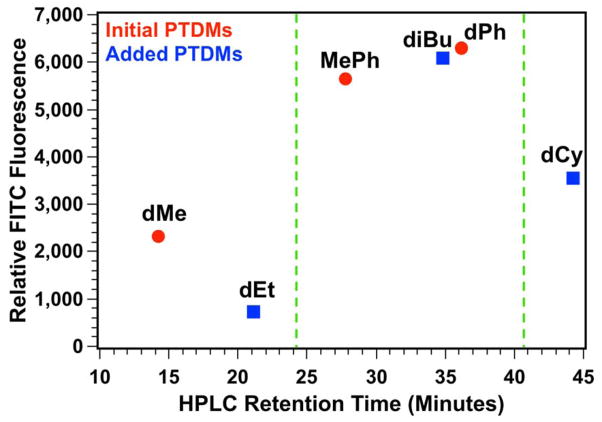
Figure 5.
Plot of relative FITC fluorescence in Jurkat T cells as it relates to monomer HPLC retention times. Green dashed lines indicate the hydrophobic window for optimal PTDM performance. Red data points represent hydrophobic monomers initially used. Blue data points represent hydrophobic monomers added after monomer hydrophobicity assessment by HPLC.

