
Figure 2.
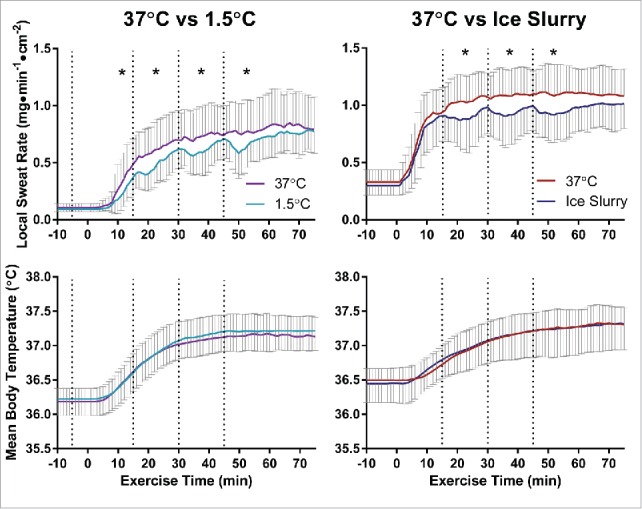
Redrawn from Morris et al. 20143 and Morris et al. 2016.4 Mean local sweat rates (top panels) and mean body temperatures (bottom panels) with 1.5°C water ingestion (left panels) and ice slurry ingestion (right panels). Dashed lines denote time points when fluids were ingested. *denotes where cold fluids are significantly lower than 37°C control fluids (P < 0.05).