
Figure 3.
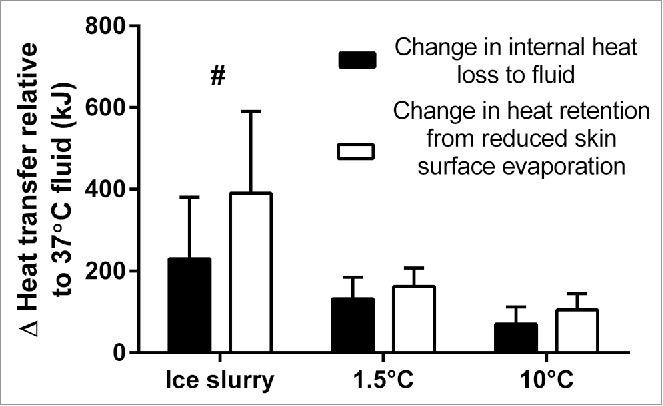
Combined data from Bain et al. 20122 and Morris et al. 2016.4 Black bars denote the amount of heat lost to the ingested fluids relative to the 37°C fluid and white bars denote the amount of heat that was retained due to reductions in sweating relative to the 37°C fluid. # denotes where heat gained from the fluids is greater than the heat lost to sweating (P < 0.05).