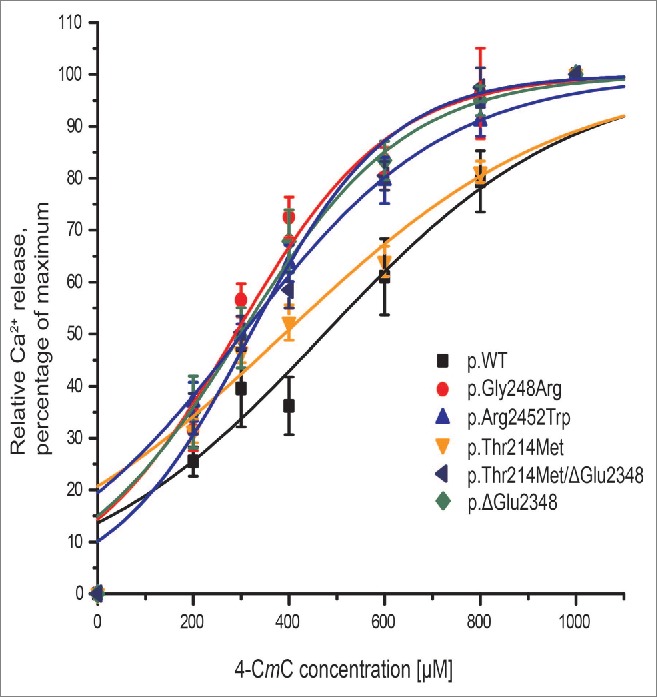
Figure 4.

Ca2+ release assays in HEK293T cells. Ca2+-release is illustrated in concentration-response curves for transiently transfected HEK293T cells. Ca2+ released was measured for 4-CmC concentrations between 0 and 1000 μM, values were normalized to Ca2+ released at 1000 μM 4-CmC and represented as mean ± SEM (n ≥ 8). Curves were plotted using OriginLab Origin 8 software.
