
Figure 2.
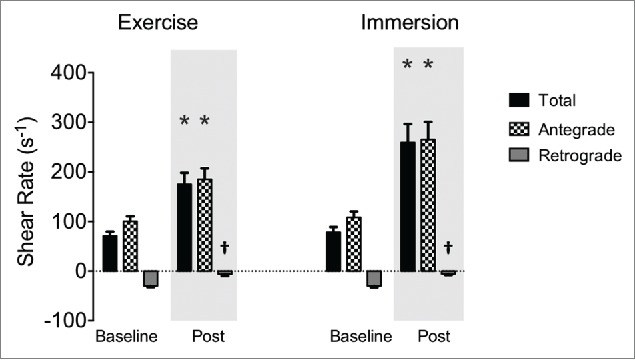
Superficial femoral artery total (black bars), antegrade (checked bars) and retrograde (gray bars) shear rate at baseline and post-intervention. Bars represent group mean, error bars are SE. * interaction: intervention x time (p<0.05); † different from baseline (p<0.05).