
Figure 3.
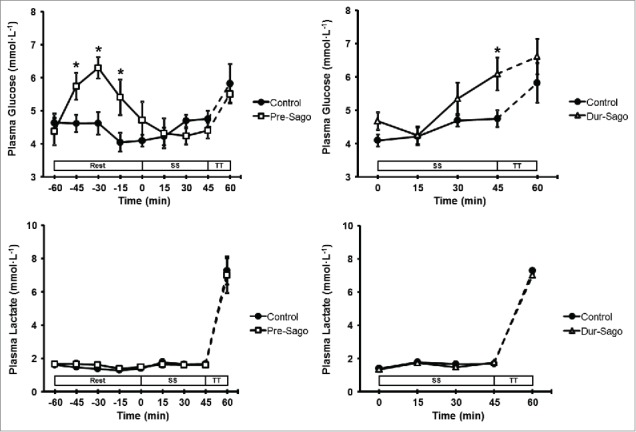
Plasma glucose and lactate concentration during rest, steady-state cycling (SS) and 15-min time trial (TT) for Control, Pre-Sago and Dur-Sago trials. Data are expressed as mean ± SE. * indicates significantly different to Control at that time-point (p < 0.05).