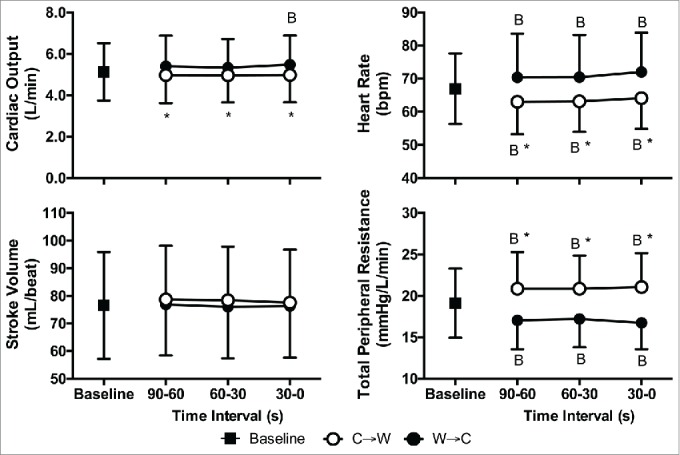
Figure 5.

Cardiac output (top-left), heart rate (top-right), stroke volume (bottom-left), and total peripheral resistance (bottom-right) at Baseline and 90 s, 60 s, and 30 s immediately prior to moving from cool to warm (C→W) and from warm to cool (W→C). Mean ± SD, n = 10. * Different from W→C (P < 0.01), BDifferent from Baseline (P < 0.01).
