
Figure 6.
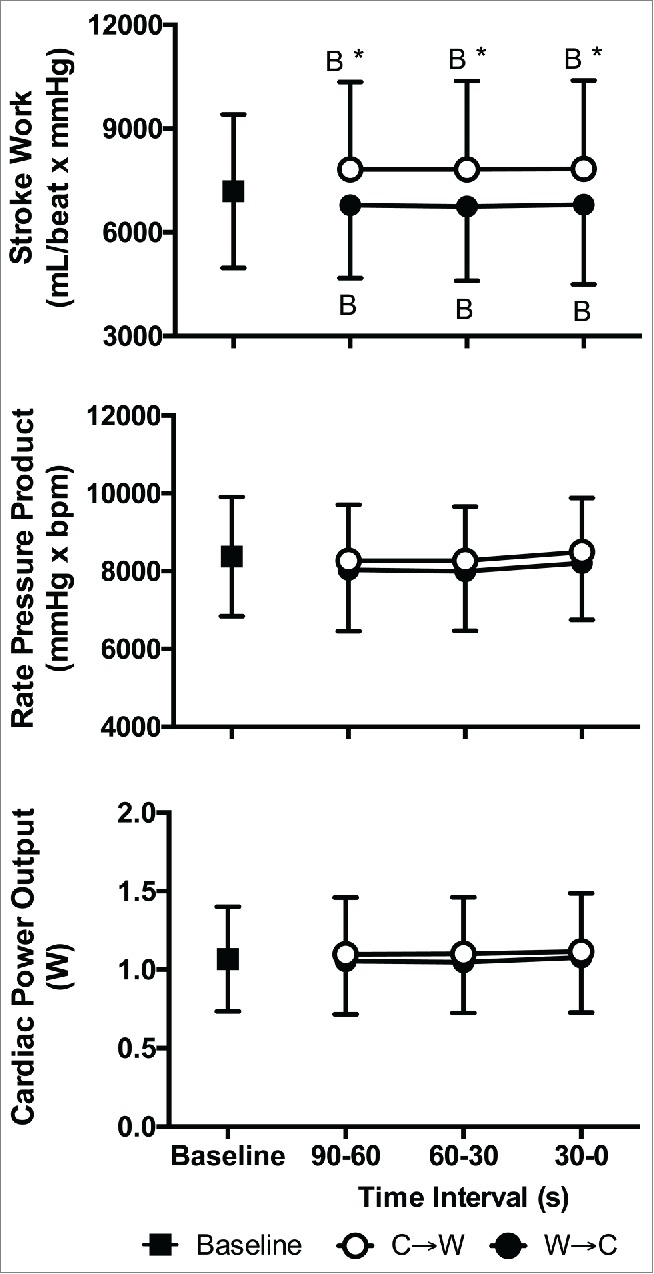
Stroke work (top), rate pressure product (middle), and cardiac power output (bottom) at Baseline and 90 s, 60 s, and 30 s immediately prior to moving from cool to warm (C→W) and from warm to cool (W→C). Mean ± SD, n = 10. * Different from W→C (P < 0.01), BDifferent from Baseline (P ≤ 0.05).