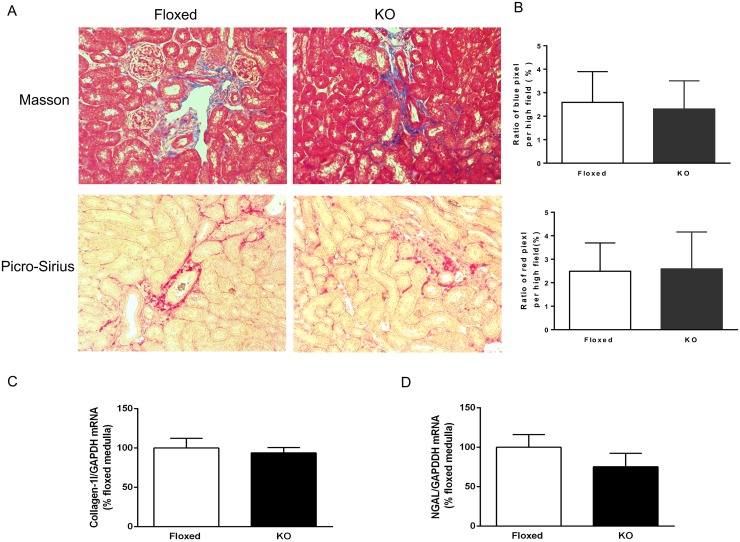
Fig 3. Renal fibrosis in floxed and CD renin KO mice after 17 days of DOCA-salt treatment.
(A) Representative images of Masson and Picro-Sirius stain for fibrosis from two different mice. Magnification: × 200. (B) Semi quantitative analysis of the proportion of total area with the blue and red color. (C) Renal medullary collagen-1 mRNA expression. (D) Renal medullary NGAL expression by RT-PCR (N = 4/group).

