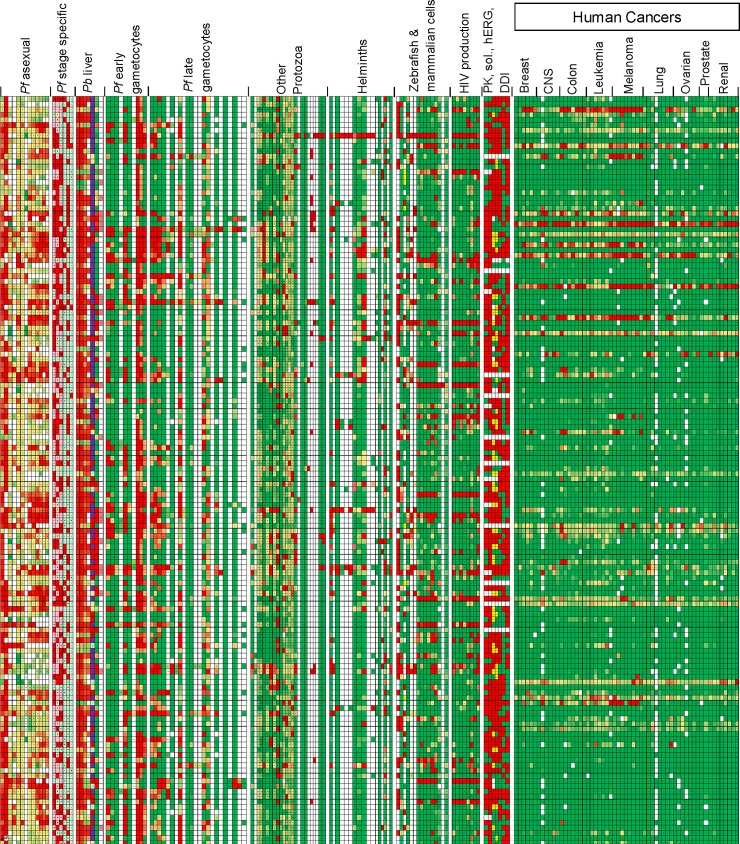
Fig 1. Malaria Box Heatmap.
Shown are selected data from the HeatMap (S1 Table) for the 400 Malaria Box compounds. Each column represents an assay (grouped by category), compounds are represented in rows. The red-green gradient represents higher to lower activity. Favorable PK activities are scored green. Pf: Plasmodium falciparum, Pb: Plasmodium berghei, PK: pharmacokinetics, sol.: solubility, hERG: human ether-a-go-go channel inhibition, DDI: drug-drug interactions (predicted).

