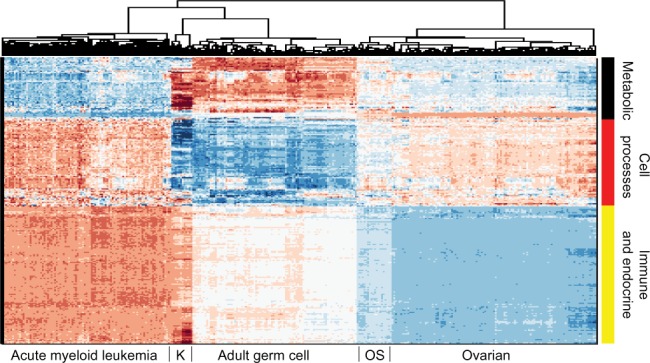
Figure 1.

Hierarchical clustering across all pathways (scored by PCA method with two PCs per pathway) of five cancer cohorts combined into a single gene expression matrix. This figure serves as a proof of concept of pathway-based clustering by demonstrating the successful grouping of patients into their respective disease types via their gene expression levels. The hierarchical clustering results are shown in the upper tree dendrogram diagram, which has been suppressed for the pathway (row) sorting. The pathway list for this heatmap appears in Supplementary Information. We intentionally do not show a color key for the heatmaps when the particular values (magnitude, sign, etc.) of the matrix being plotted are not directly interpretable or valuable. In this case, since the values are from PCA, we do not include a color key. Note that the two ovarian sets intermingle and thus are not individually discernible, which validates that mRNA data from different studies can be analyzed together.
Abbreviations: K, kidney; OS, osteosarcoma.
