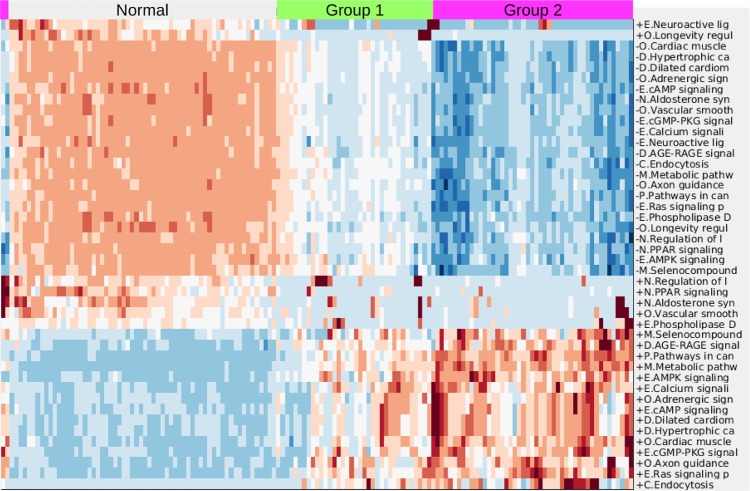
Figure 3.
Clustergram for lung case including normal tissues. Colors are automatically scaled for optimal visual distinction; thus, the color bar is omitted. For the cancer samples (group 1 and group 2), red indicates increased expression levels of genes in the pathways and blue indicates decreased expression levels. The first letter of each pathway is an abbreviation for the KEGG pathway grouping. “+” stands for increased expression of the pathway genes in the cancer samples and “−” stands for decreased expression.
Abbreviations: E, environmental information processing; O, other organismal systems; D, diseases other than cancer; M, metabolic; C, cellular processes; P, pathways in cancer; N, endocrine.

