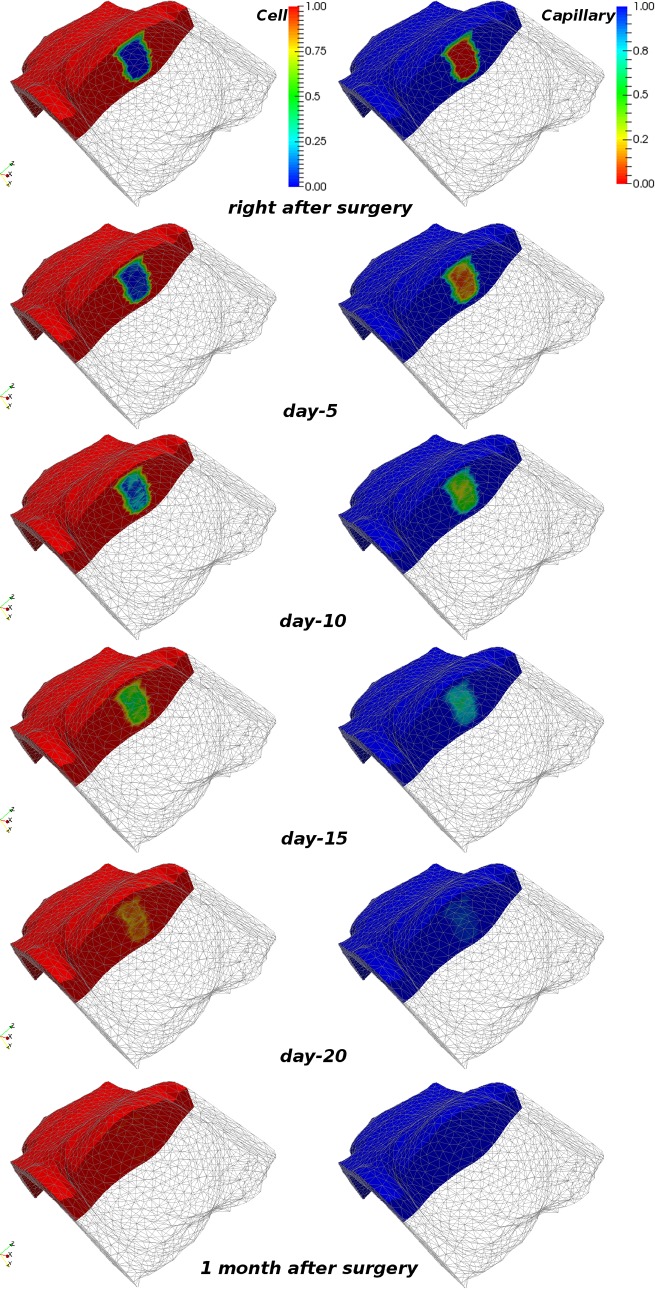
Fig 5. Snapshots of the cell and capillary density predictions during wound healing simulation.
Numerical results of the wound healing simulation for patient-specific model P-3 (in supine) depicting the evolution of cell and capillary density at various time instants. The operated breast is clipped to facilitate visualisation of the dynamic changes of the species in the wounded area. The left and right column depict the (normalised dimensionless) cell and capillary density, respectively.

