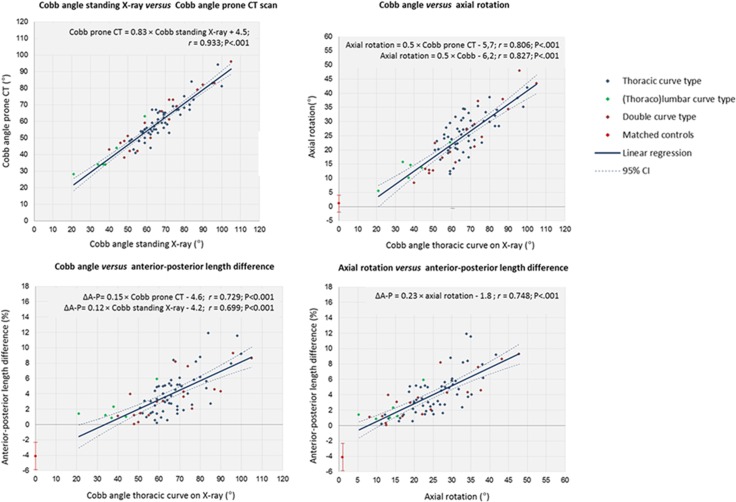
Fig 2. Correlation between Cobb angle of the main thoracic curve on standing radiographs versus prone CT scans, between the deformation in three-dimensions.
Pearson’s correlation coefficients (r), linear regression equations and significance levels are shown including the 95% confidence interval (95% CI). For the control group, mean and standard deviations (error bars) are shown.

