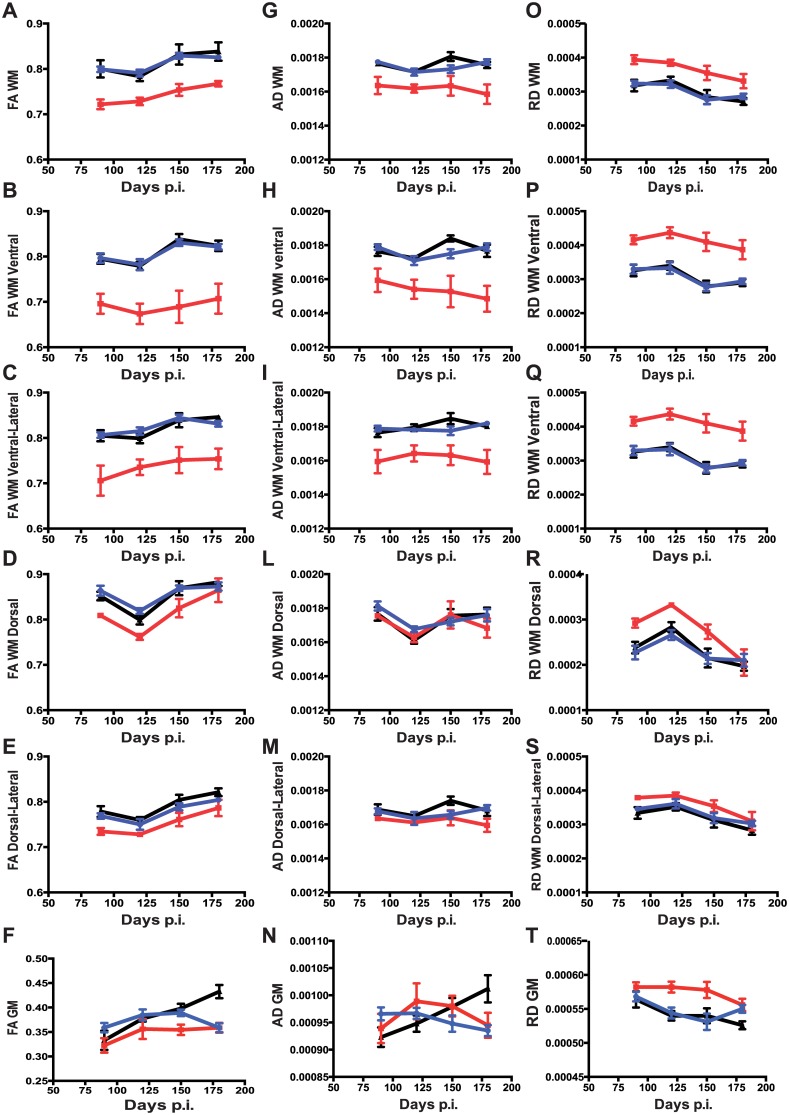
Fig 4. Longitudinal study of DTI measures in TMEV infected mice.
Group-based trajectory models of fractional anisotropy FA (A-F), axial diffusivity AD (G-N) and radial diffusivity RD (M-T) measures in different white matter regions-of-interest (ROI) and total grey matter. DTI measures were acquired from n = 18 mice (n = 4 TMEV PCR-positive, n = 8 TMEV PCR-negative and 6 sham mice). Mice were longitudinally followed from day 90 to day 190 p.i with repeat spinal cord DTI every 30 days, i.e. a total of 4 imaging time-points for each mouse. Solid red circles indicate TMEV PCR-positive mice, solid blue circles indicate TMEV PCR-negative mice, and solid black triangles indicate sham controls. Data are shown as mean value at each time point ± SEM.

