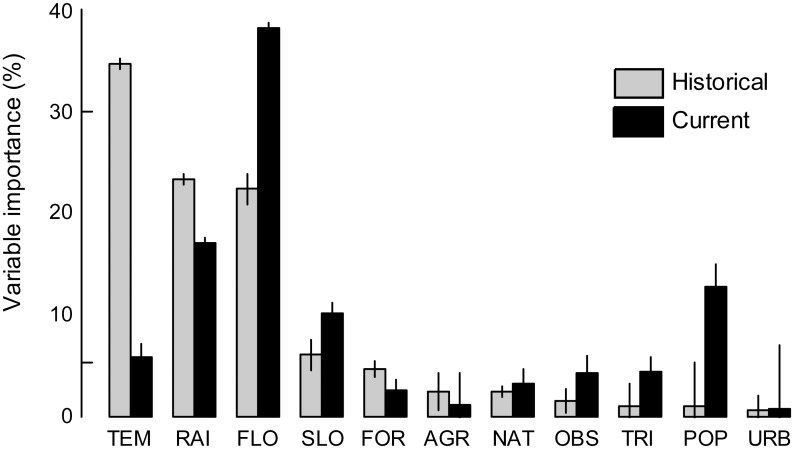
Fig 3. Relative contribution (%) of each environmental variable in the models for the two periods.
The historical period is depicted in grey while the current period is shown in white. Barplots indicate the mean importance (± standard error) across the six modelling methods. The environmental variables are sorted by decreasing importance for the current period.

