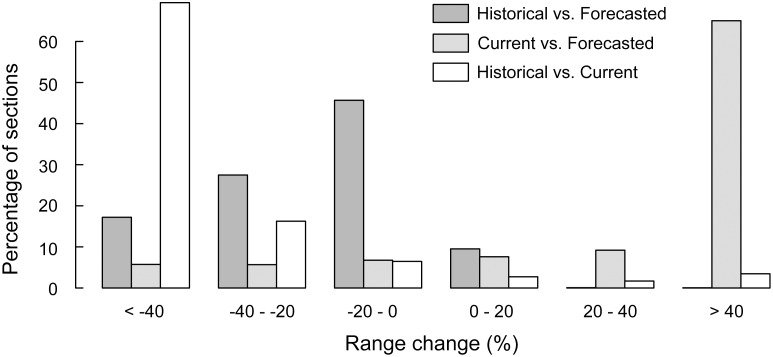
Fig 6. Distribution of occurrence probabilities changes.
Changes between the historical and forecasted models (i.e. expected range change) are shown in dark grey, the ones between the forecasted and current models in light grey, and the ones between historical and current models (i.e. modelled range change) in white.

