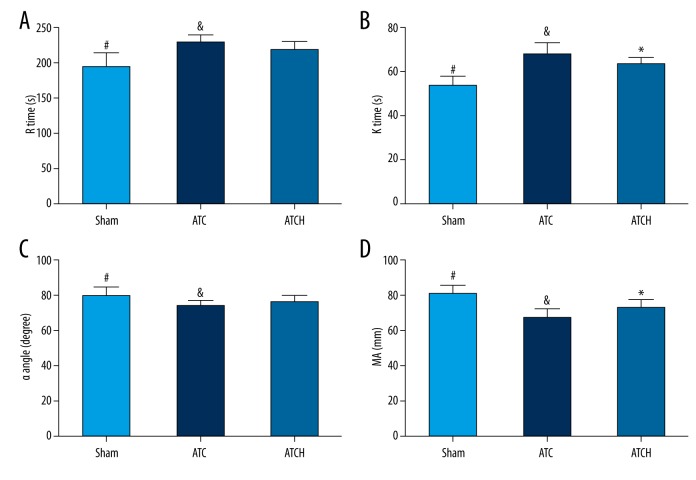
Figure 4.
Effects of HMGB1 blockade on thrombelastography (TEG) parameters including (A) R time, (B) K time, (C) α angle, and (D) maximal amplitude (MA) in the sham, ATC, and ATCH (ATC with HMGB1 blockade) groups at 2 h after baseline. Data are expressed as mean ±SD. * P<0.05, ATC versus ATCH; & P<0.05, ATC versus sham; # P<0.05, sham versus ATCH.

