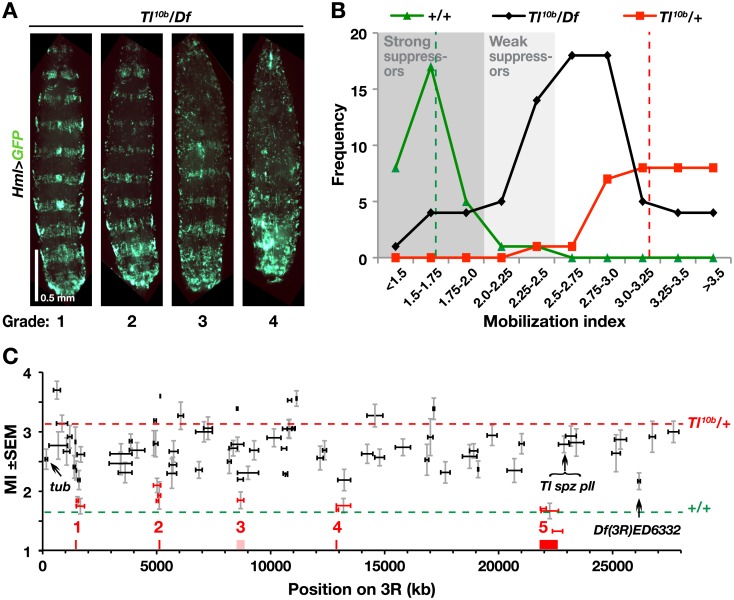
Fig 1. A genomic deletion screen on chromosome arm 3R identifies five candidate regions that suppress the sessile hemocyte disruption phenotype of Tl10b.
A. Third instar larvae from Tl10b/deficiency (Tl10b/Df) crosses, representing the four phenotype grades, categorized according to the number of body segments with intact bands of sessile cells visualized with HmlΔ-GAL4-driven UAS-GFP (Hml>GFP). The larvae are oriented with the anterior end up. B. Frequency distribution of mobilization indices, calculated as the average grade for larvae of each genotype. Each point shows the number of Tl10b/Df crosses that gave mobilization indices in the indicated interval (black line), compared to the control Tl10b (red line) and wild-type (green line) crosses. Dashed red and green lines indicate the average mobilization index of all Tl10b (3.21, SD = 0.36) and wild-type (1.66, SD = 0.25) control crosses, respectively. Grey areas show our classification of the deficiencies as weak or strong suppressors. C. All tested deficiencies, plotted on the x-axis according to size and relative position on the right arm of the third chromosome, and on the y-axis according to mobilization index (MI, +/- standard error of mean, n = 16–22). Deficiencies categorized as strong suppressors are depicted in red. The red and green dashed lines indicate the average mobilization indices for the Tl10b and control crosses respectively, the latter corresponding to full suppression of the Tl10b phenotype.

