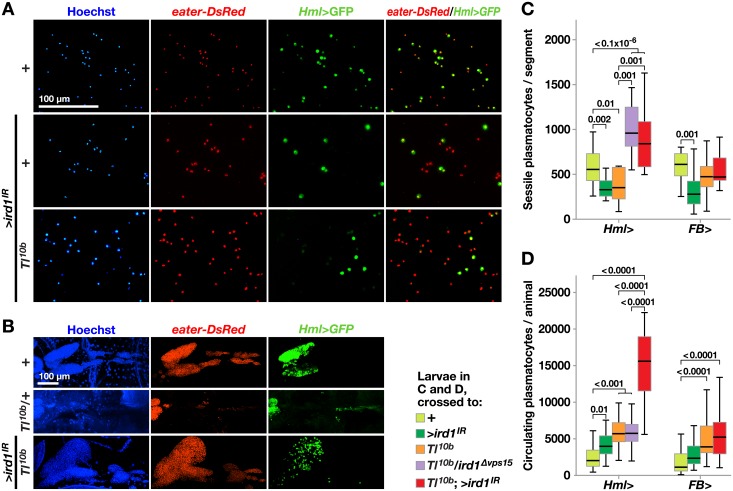
Fig 3. Silencing ird1 in hemocytes reduces the fraction of HmlΔ>GFP–positive cells, while increasing total blood cell numbers and rescuing lymph gland morphology in Tl10b larvae.
A. Circulating blood cells are visualized by HmlΔ-GAL4-driven UAS-GFP (green) and eater-DsRed (red) plasmatocyte reporter. Overexpression of UAS-GFP alone (+), or together with UAS-ird1IR (>ird1IR) in wild-type (+) or Tl10b genetic background. B. Dissected lymph glands from larvae of the indicated genotypes (the anterior end to the left). Nuclear Hoechst staining (blue) and eater-DsRed expression visualize the entire organ, whereas the HmlΔ>GFP signal is seen mostly in primary lobes. Between 8–10 lymph glands per genotype were analyzed. C, D. Number of eater-DsRed expressing sessile plasmatocytes in a single body segment (C) or extracted from circulation of larvae (D), carrying HmlΔ- or FB-GAL4 alone (+), together with either UAS-ird1IR (>ird1IR), Tl10b, ird1Δvps15 or both of the latter. Plasmatocytes of the same blood cell populations were also counted for larvae carrying UAS-Tl10b alone (>Tl10b) or in combination with HmlΔ-GAL4. Box-plots in C depict medians and quartiles for number of sessile cells counted automatically using imaging software in microscopic images of 12–15 individual larvae per genotype. For D, 30 larvae per genotype were bled and plasmatocyte numbers assessed using a hemocytometer. Values for significant differences from pairwise comparisons by post-hoc tests after two-way ANOVA are depicted above the whiskers in C and D. Hemocytes in A were imaged by fluorescence microscopy, whereas lymph gland images in B are maximum intensity projections of z-stacks generated by confocal microscopy.

